 15
15peptides
spectra
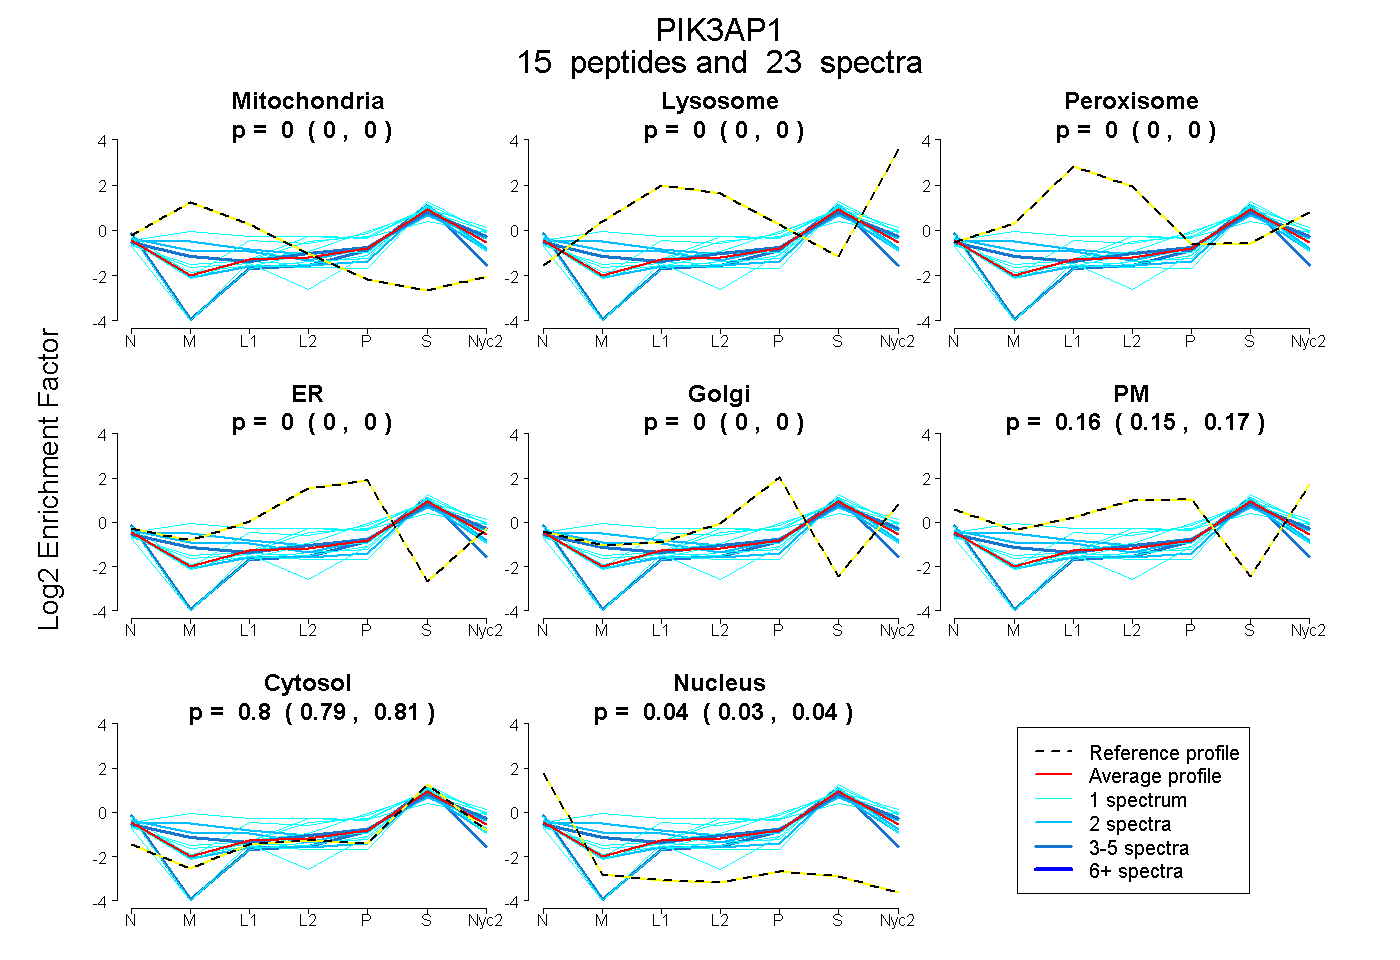
0.000 | 0.000
0.000 | 0.000
0.000 | 0.000
0.000 | 0.000
0.000 | 0.000
0.152 | 0.169
0.793 | 0.806
0.032 | 0.044
| Plot | Mito | Lyso | Perox | ER | Golgi | PM | Cytosol | Nucleus | |||||
| Expt A |
15 peptides |
23 spectra |
|
0.000 0.000 | 0.000 |
0.000 0.000 | 0.000 |
0.000 0.000 | 0.000 |
0.000 0.000 | 0.000 |
0.000 0.000 | 0.000 |
0.161 0.152 | 0.169 |
0.800 0.793 | 0.806 |
0.039 0.032 | 0.044 |
| 1 spectrum, ALPFSK | 0.000 | 0.000 | 0.000 | 0.000 | 0.000 | 0.125 | 0.841 | 0.034 | ||
| 3 spectra, AASQRPLTR | 0.000 | 0.000 | 0.000 | 0.000 | 0.000 | 0.000 | 0.828 | 0.172 | ||
| 1 spectrum, HADLEITVPIR | 0.133 | 0.042 | 0.207 | 0.000 | 0.058 | 0.118 | 0.442 | 0.000 | ||
| 1 spectrum, LGIVNVDEAVLHFK | 0.074 | 0.000 | 0.000 | 0.000 | 0.011 | 0.000 | 0.828 | 0.088 | ||
| 4 spectra, VSTEVEFSPEDSPSVR | 0.068 | 0.000 | 0.000 | 0.000 | 0.000 | 0.201 | 0.731 | 0.000 | ||
| 1 spectrum, VEFGVYESGPR | 0.000 | 0.000 | 0.000 | 0.000 | 0.129 | 0.165 | 0.706 | 0.000 | ||
| 2 spectra, APDLSSGNVSLK | 0.000 | 0.000 | 0.000 | 0.000 | 0.000 | 0.056 | 0.845 | 0.100 | ||
| 1 spectrum, DEELPTLLHFAAK | 0.000 | 0.000 | 0.000 | 0.114 | 0.000 | 0.125 | 0.761 | 0.000 | ||
| 2 spectra, HSQHLPGK | 0.193 | 0.000 | 0.004 | 0.000 | 0.001 | 0.109 | 0.693 | 0.000 | ||
| 1 spectrum, HTDLPLETSPGNLMVVQPDR | 0.000 | 0.044 | 0.000 | 0.000 | 0.037 | 0.207 | 0.711 | 0.000 | ||
| 2 spectra, QFIDEYVETVDMLK | 0.185 | 0.067 | 0.013 | 0.000 | 0.000 | 0.119 | 0.616 | 0.000 | ||
| 1 spectrum, VGNFYVSSESIR | 0.000 | 0.000 | 0.150 | 0.011 | 0.135 | 0.024 | 0.680 | 0.000 | ||
| 1 spectrum, GPGPTQVDGAPVVTGTPVGILERPPR | 0.000 | 0.000 | 0.000 | 0.000 | 0.000 | 0.000 | 0.980 | 0.020 | ||
| 1 spectrum, TDSTSSTASSTSNR | 0.000 | 0.000 | 0.000 | 0.000 | 0.000 | 0.040 | 0.906 | 0.053 | ||
| 1 spectrum, LVPDACFSSQDLSVFR | 0.075 | 0.000 | 0.000 | 0.000 | 0.000 | 0.000 | 0.842 | 0.083 |
| Plot | Mito | Lyso or Perox | ER | Golgi | PM | Cytosol | Nucleus | ||||||
| Expt B |
3 peptides |
4 spectra |
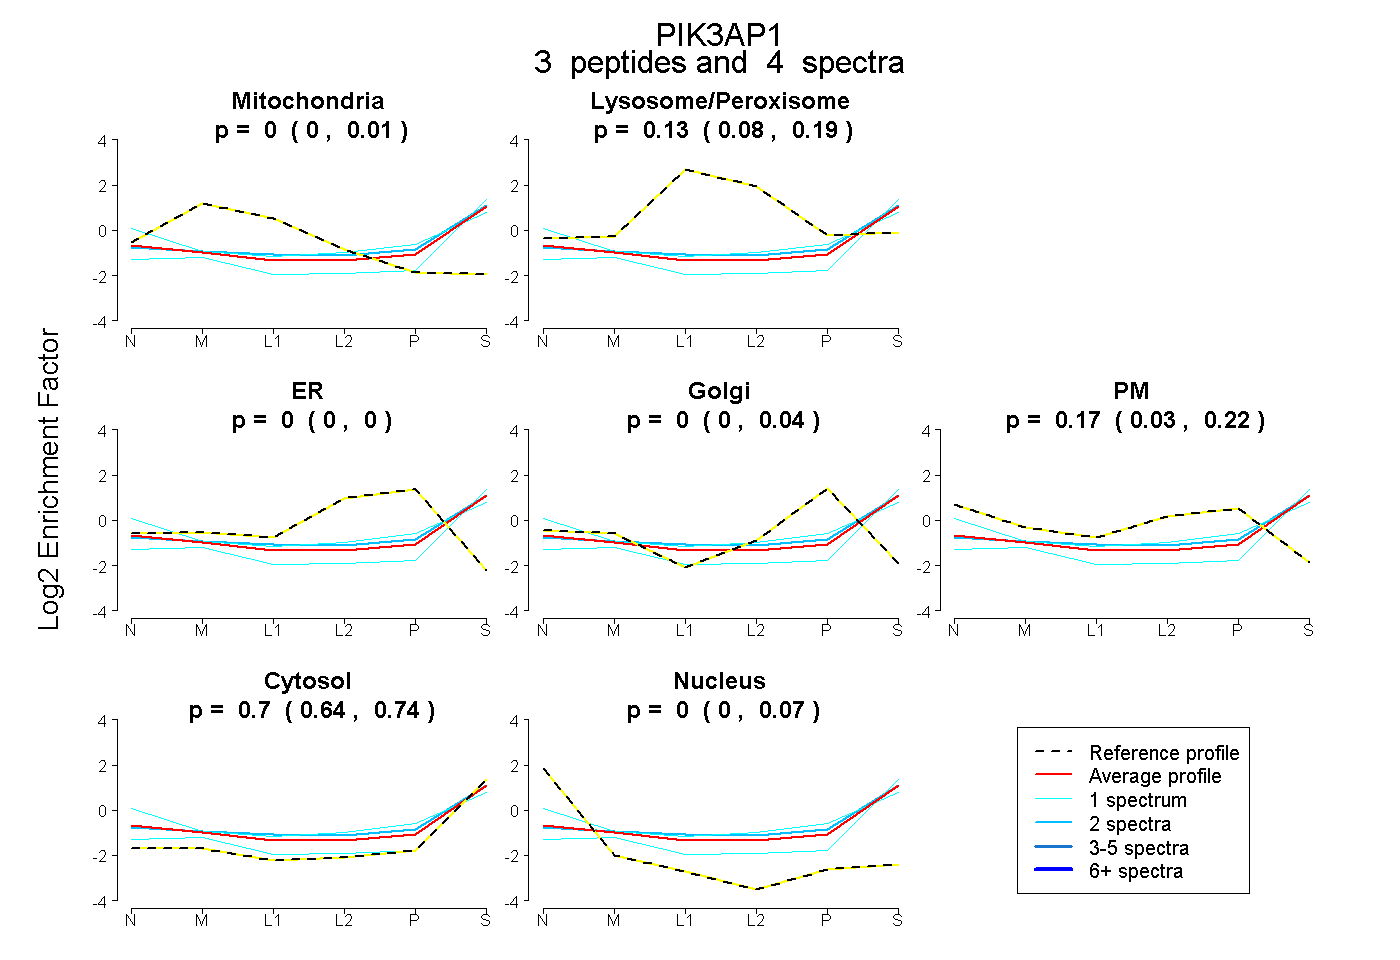 |
0.000 0.000 | 0.014 |
0.128 0.078 | 0.191 |
0.000 0.000 | 0.000 |
0.000 0.000 | 0.043 |
0.170 0.030 | 0.224 |
0.703 0.639 | 0.739 |
0.000 0.000 | 0.067 |
|||
| Plot | Lyso | Other | |||||||||||
| Expt C |
11 peptides |
20 spectra |
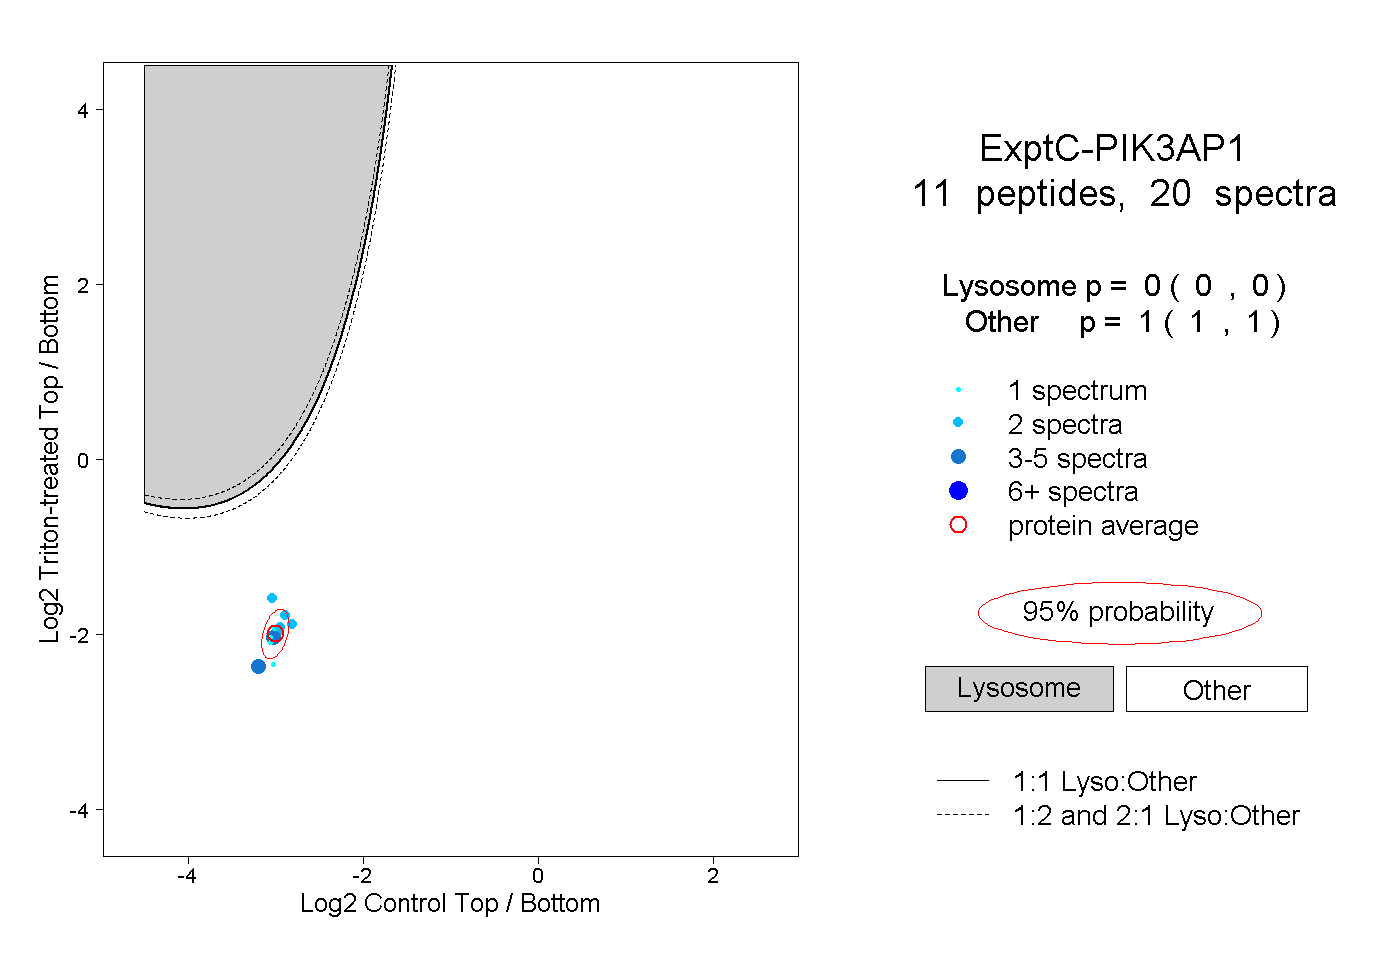 |
0.000 0.000 | 0.000 |
1.000 1.000 | 1.000 |