 5
5peptides
spectra
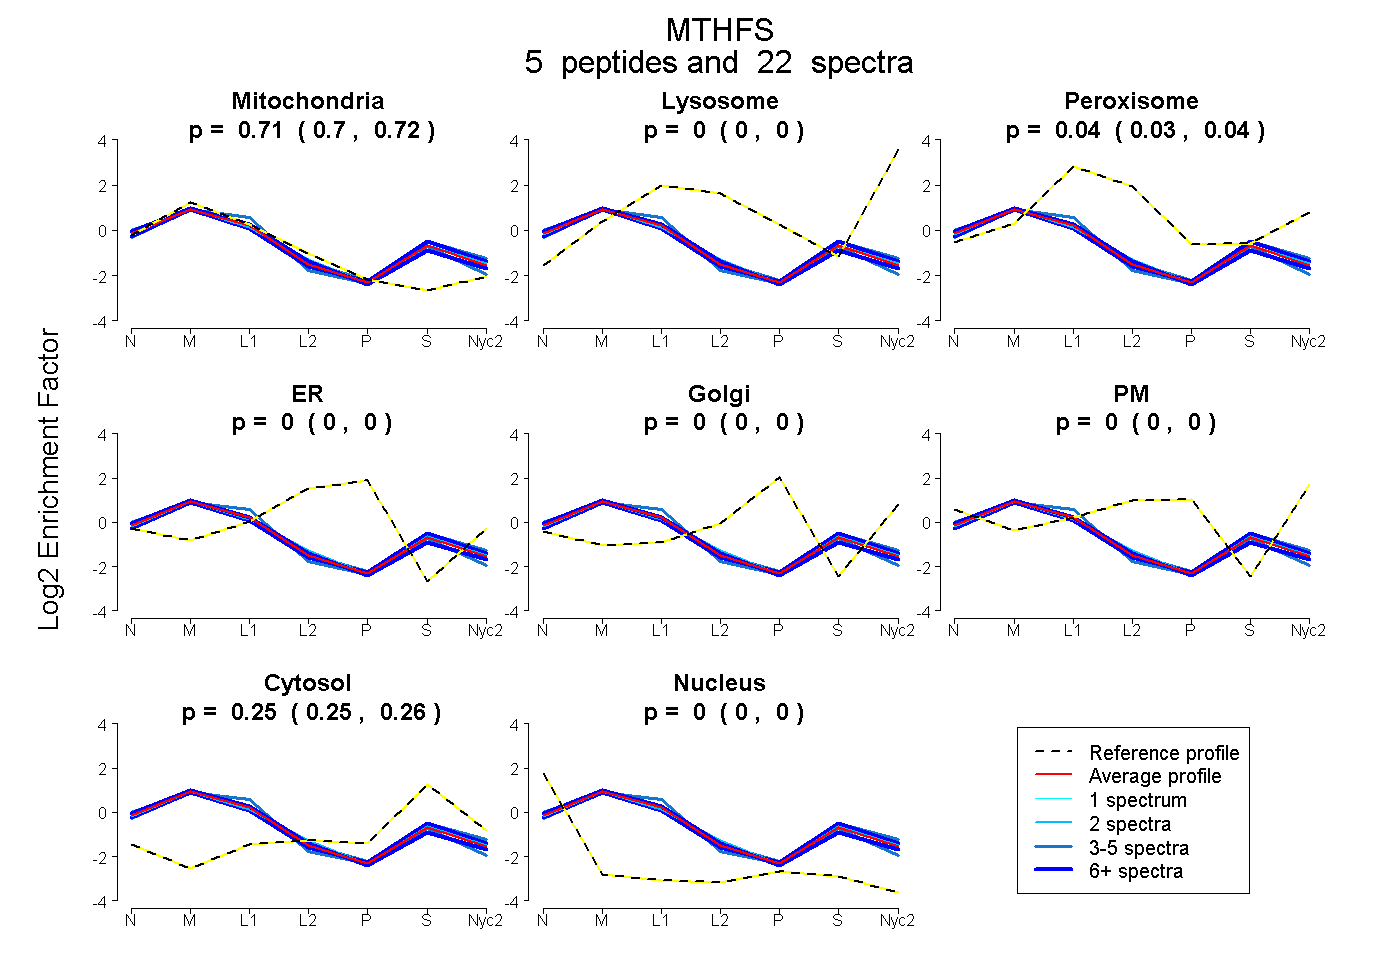
0.702 | 0.720
0.000 | 0.000
0.026 | 0.044
0.000 | 0.000
0.000 | 0.000
0.000 | 0.000
0.247 | 0.257
0.000 | 0.000
4peptides
spectra
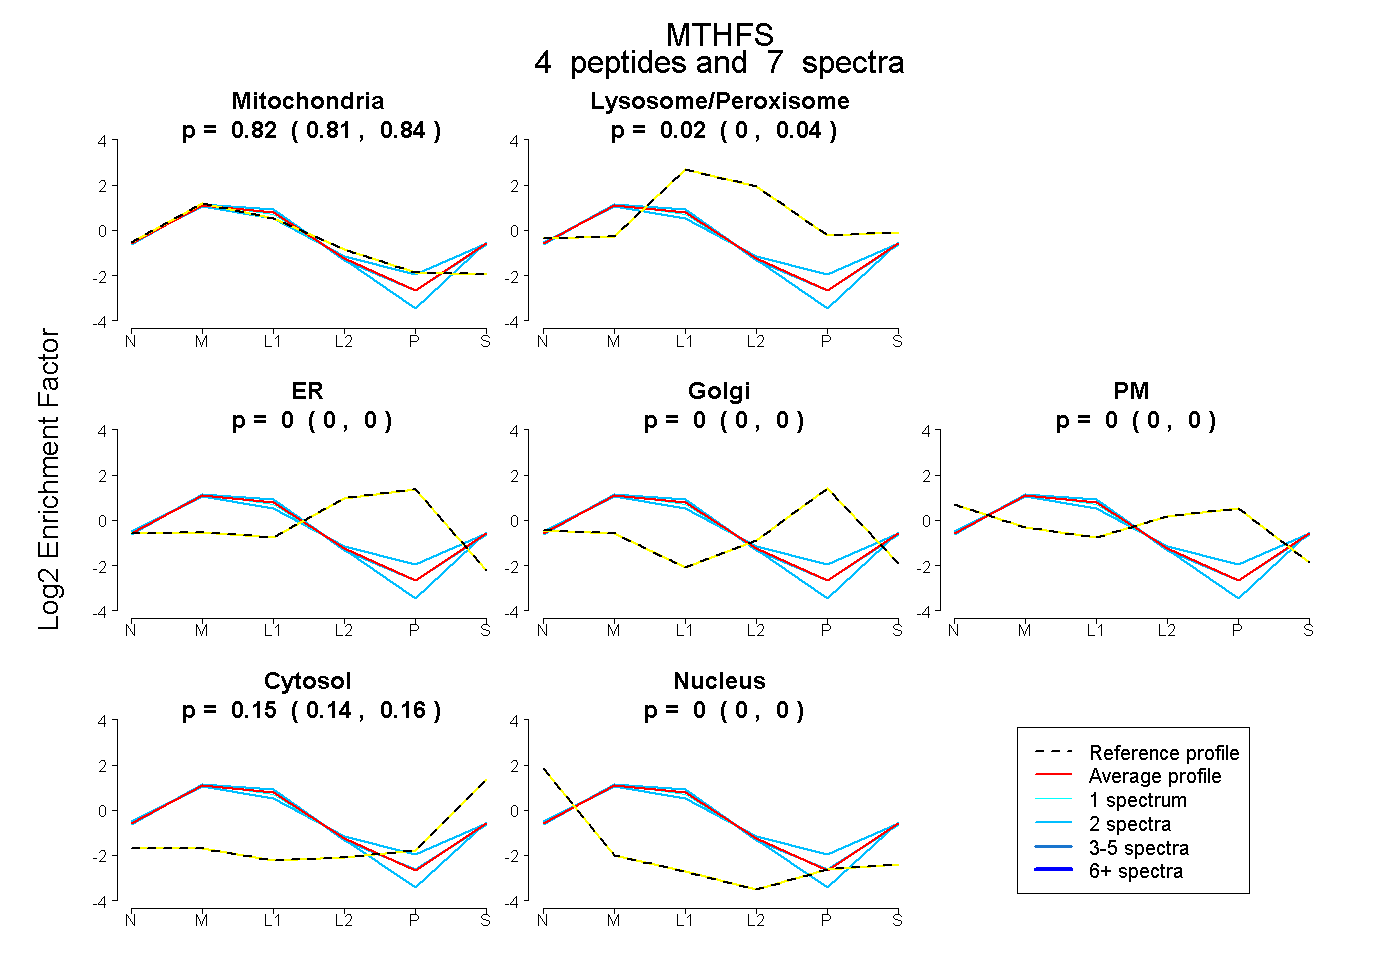
0.806 | 0.842
0.000 | 0.040
0.000 | 0.000
0.000 | 0.000
0.000 | 0.000
0.144 | 0.159
0.000 | 0.000
10peptides
spectra
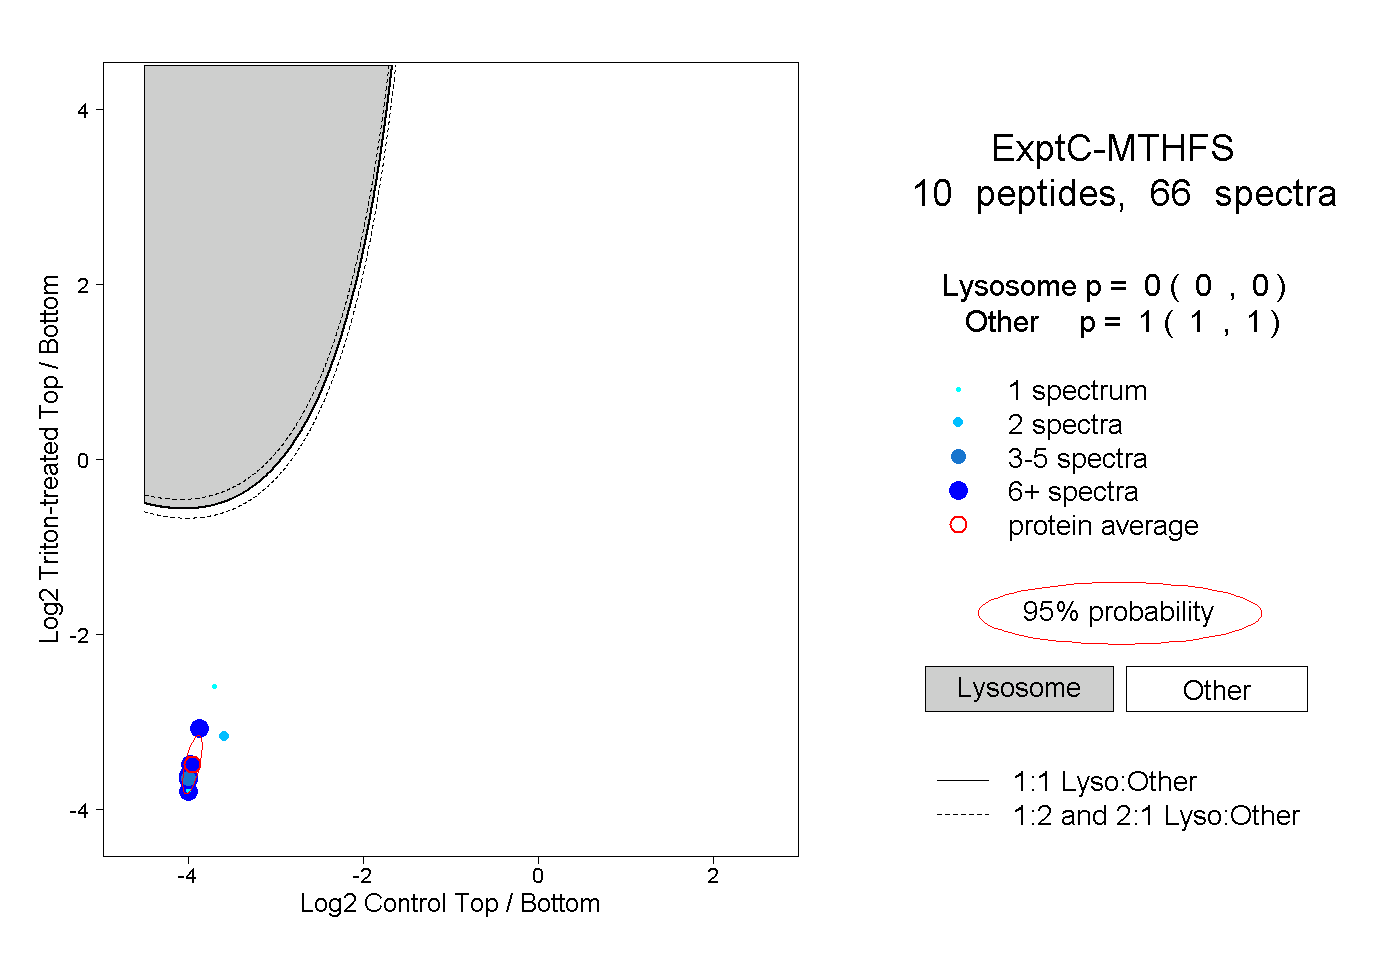
0.000 | 0.000
1.000 | 1.000
1peptide
spectra
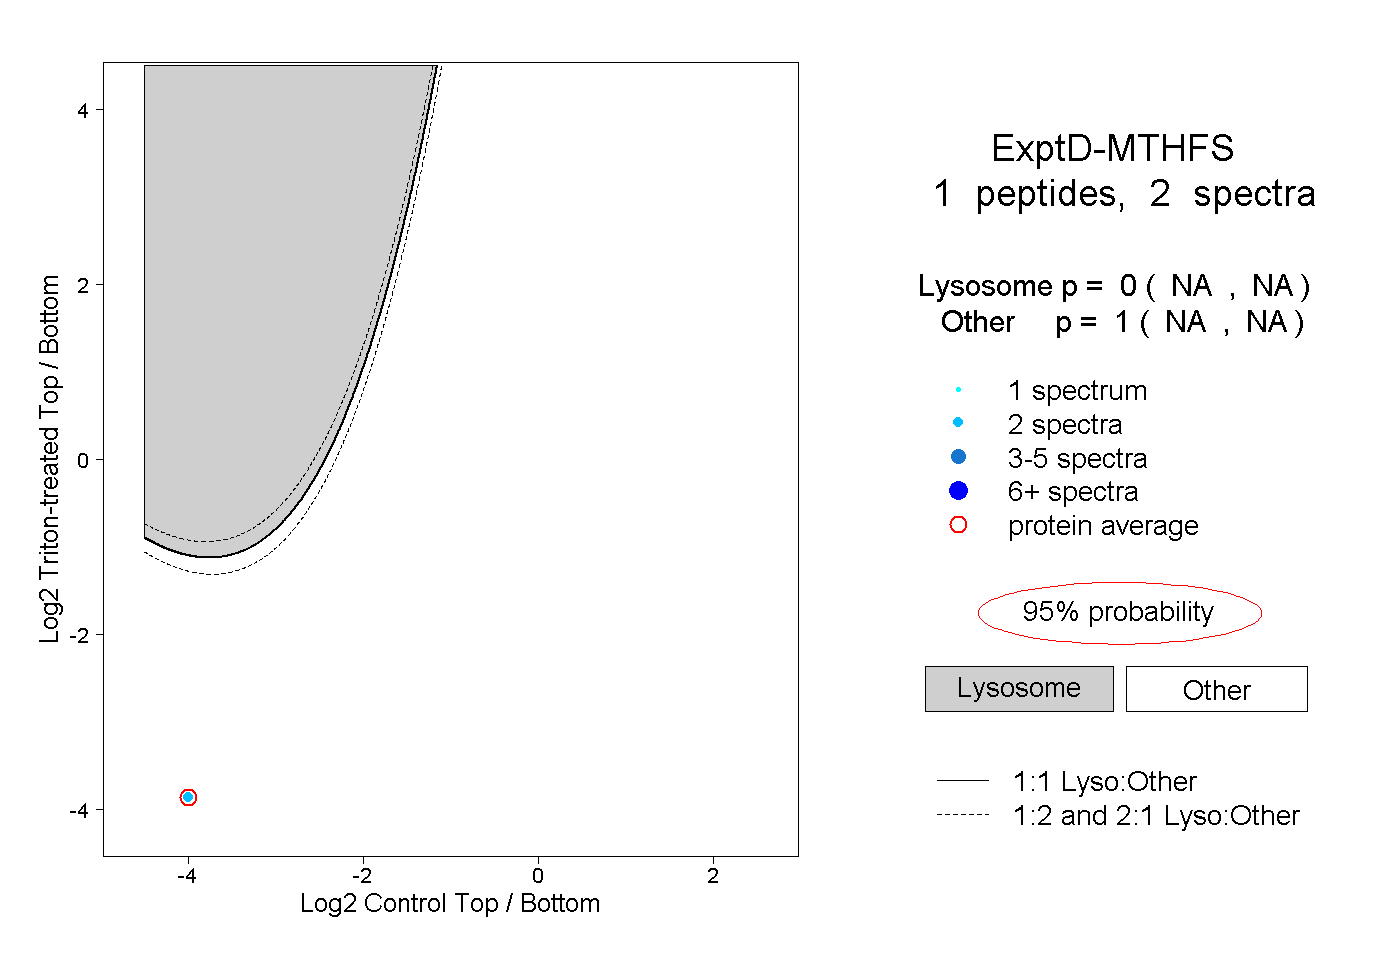
NA | NA
NA | NA