 5
5peptides
spectra
0.702 | 0.720
0.000 | 0.000
0.026 | 0.044
0.000 | 0.000
0.000 | 0.000
0.000 | 0.000
0.247 | 0.257
0.000 | 0.000
| Plot | Mito | Lyso | Perox | ER | Golgi | PM | Cytosol | Nucleus | |||||
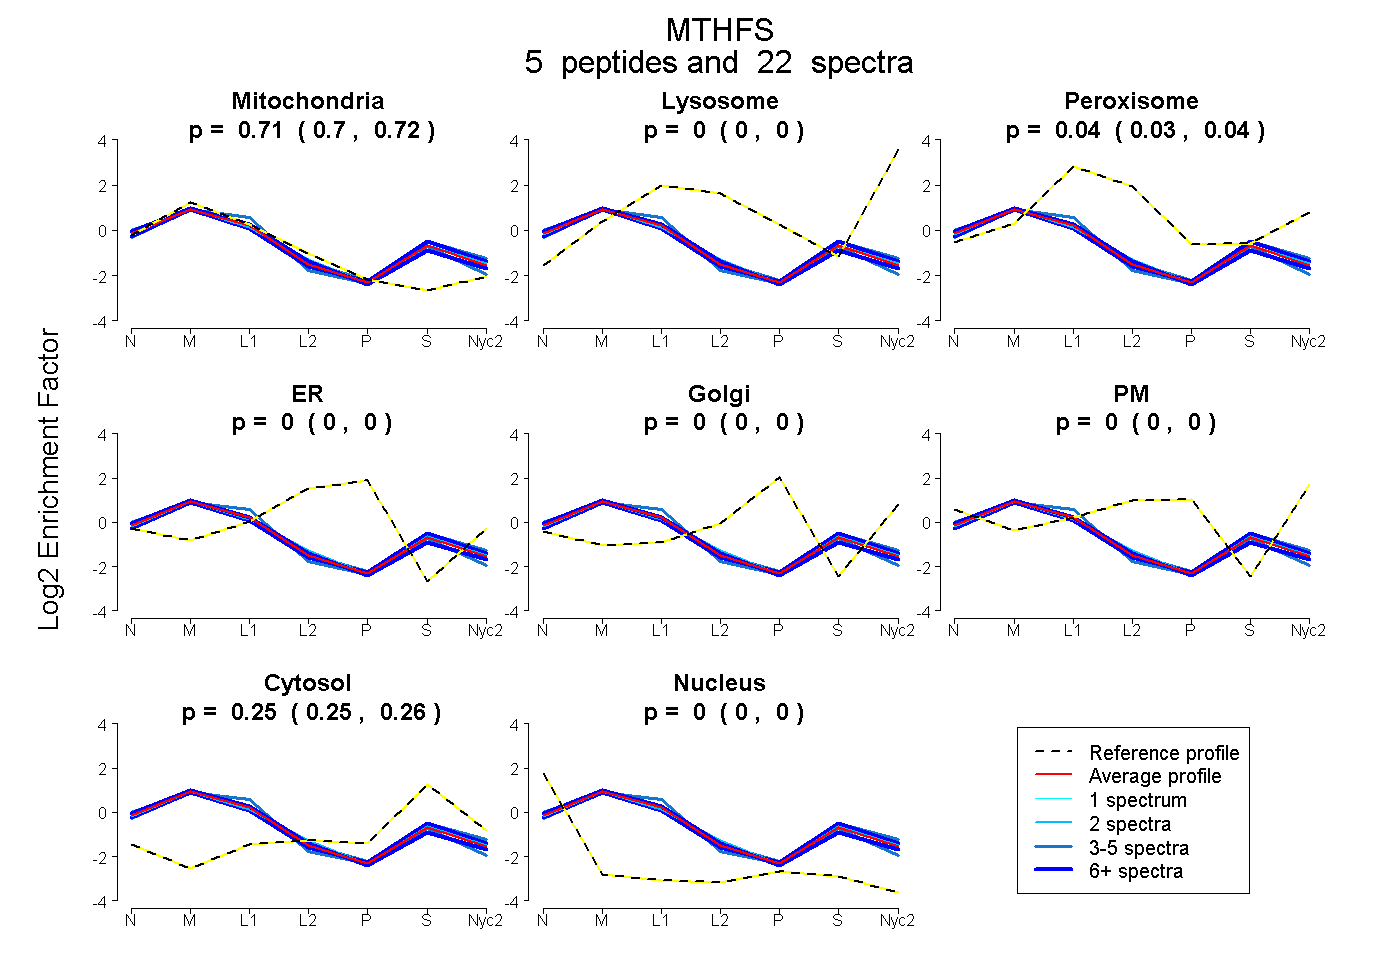
| Expt A |
5 peptides |
22 spectra |
|
0.711 0.702 | 0.720 |
0.000 0.000 | 0.000 |
0.036 0.026 | 0.044 |
0.000 0.000 | 0.000 |
0.000 0.000 | 0.000 |
0.000 0.000 | 0.000 |
0.252 0.247 | 0.257 |
0.000 0.000 | 0.000 |
| 6 spectra, VKPYTLALAFR | 0.756 | 0.000 | 0.030 | 0.000 | 0.000 | 0.000 | 0.214 | 0.000 | ||
| 7 spectra, ICFIPR | 0.678 | 0.000 | 0.032 | 0.000 | 0.000 | 0.000 | 0.290 | 0.000 | ||
| 4 spectra, ALGAEER | 0.752 | 0.000 | 0.000 | 0.000 | 0.000 | 0.000 | 0.248 | 0.000 | ||
| 3 spectra, GYYDTYLK | 0.665 | 0.000 | 0.076 | 0.000 | 0.000 | 0.000 | 0.259 | 0.000 | ||
| 2 spectra, VIAHSQYQNSK | 0.696 | 0.000 | 0.055 | 0.000 | 0.000 | 0.000 | 0.249 | 0.000 |
| Plot | Mito | Lyso or Perox | ER | Golgi | PM | Cytosol | Nucleus | ||||||
| Expt B |
4 peptides |
7 spectra |
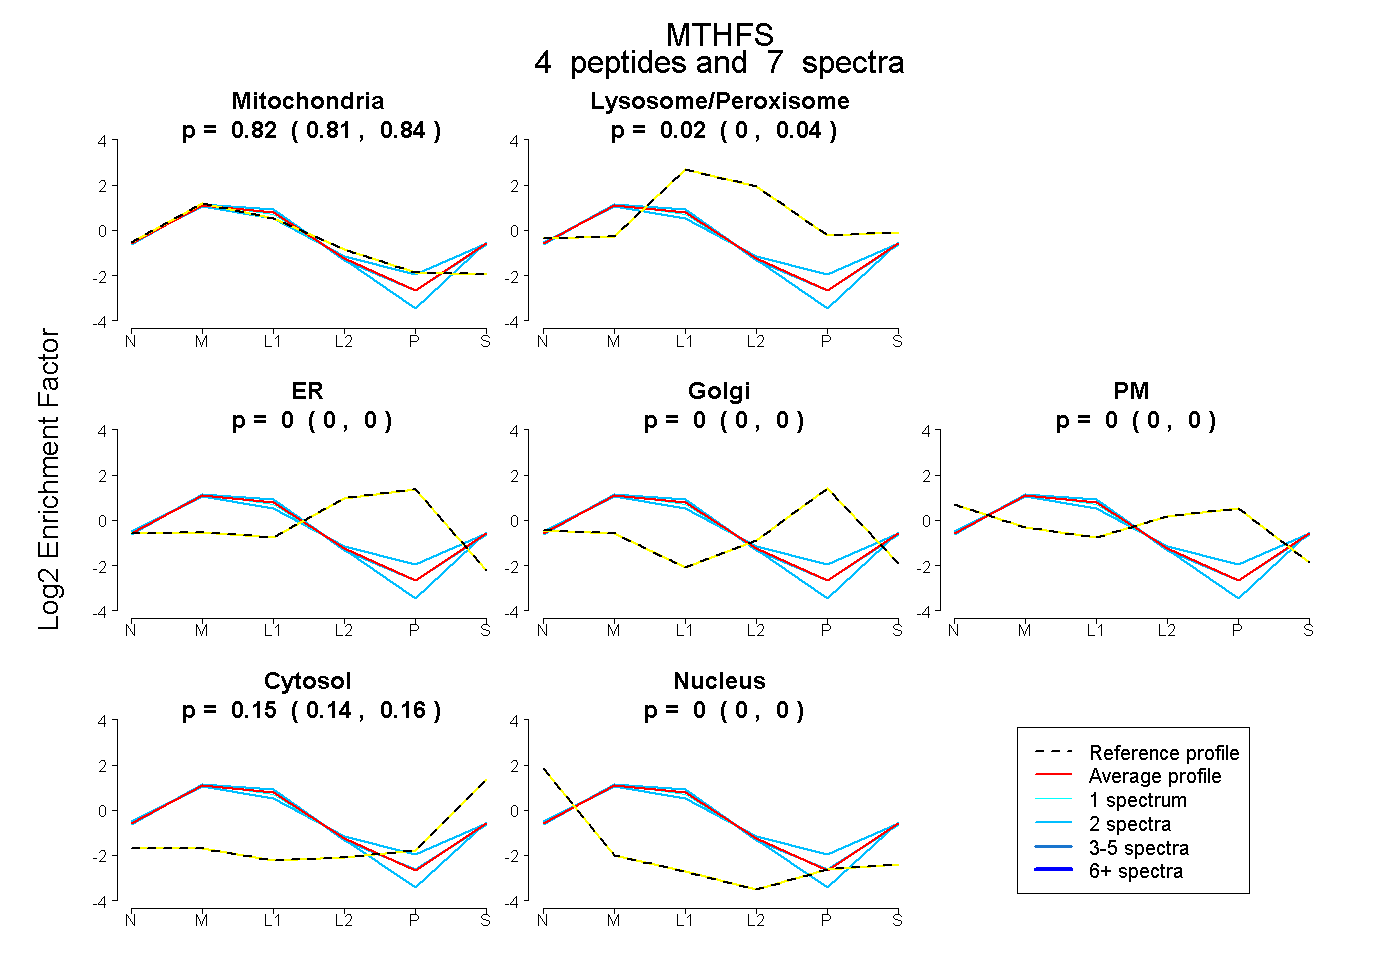 |
0.825 0.806 | 0.842 |
0.023 0.000 | 0.040 |
0.000 0.000 | 0.000 |
0.000 0.000 | 0.000 |
0.000 0.000 | 0.000 |
0.152 0.144 | 0.159 |
0.000 0.000 | 0.000 |
|||
| Plot | Lyso | Other | |||||||||||
| Expt C |
10 peptides |
66 spectra |
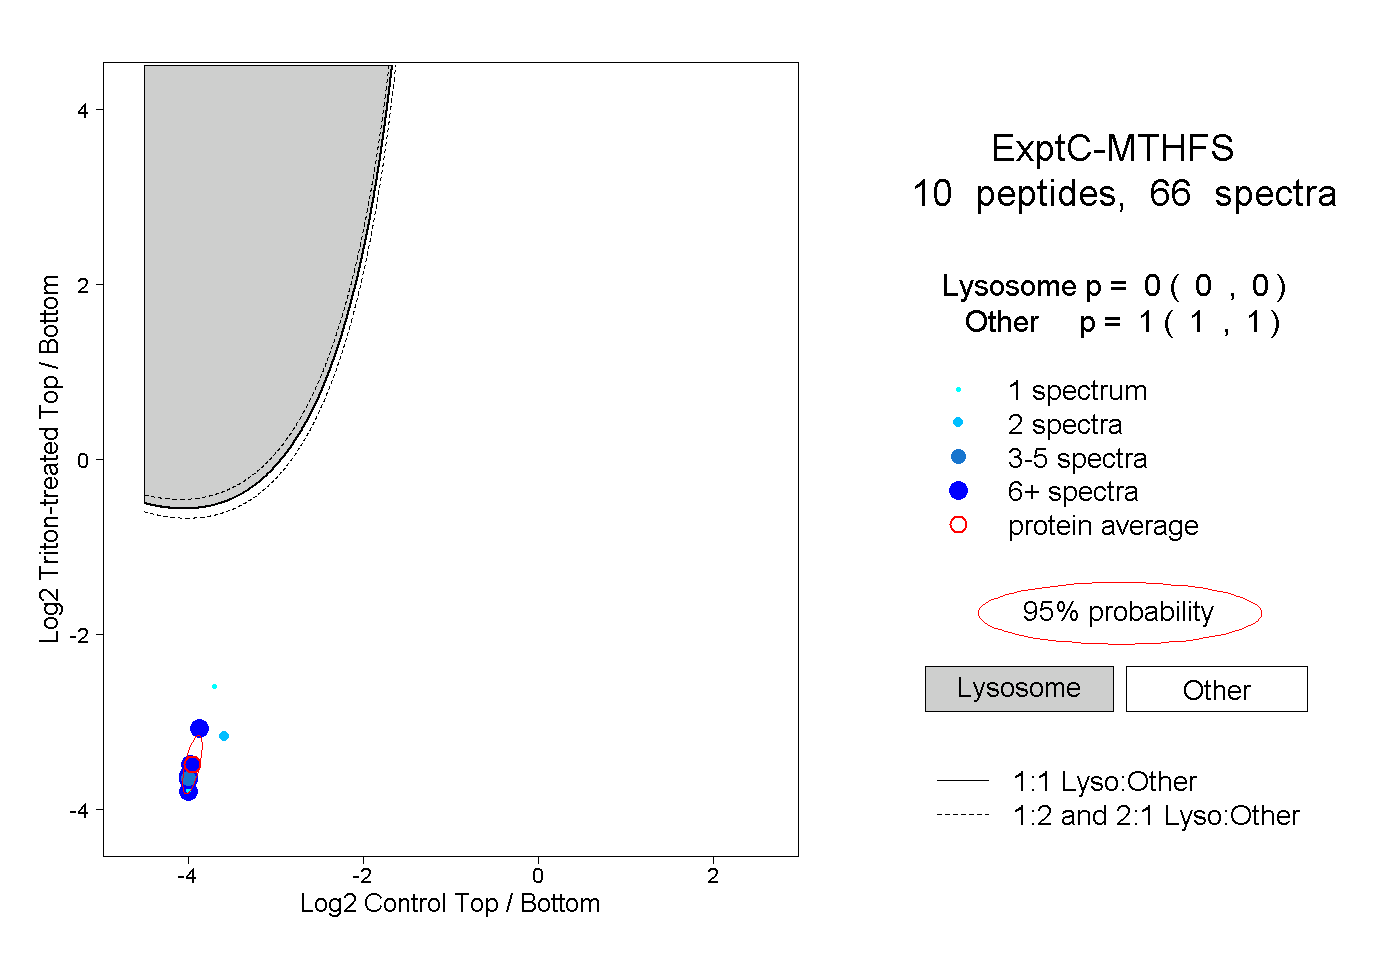 |
0.000 0.000 | 0.000 |
1.000 1.000 | 1.000 |
||||||||
| Plot | Lyso | Other | |||||||||||
| Expt D |
1 peptide |
2 spectra |
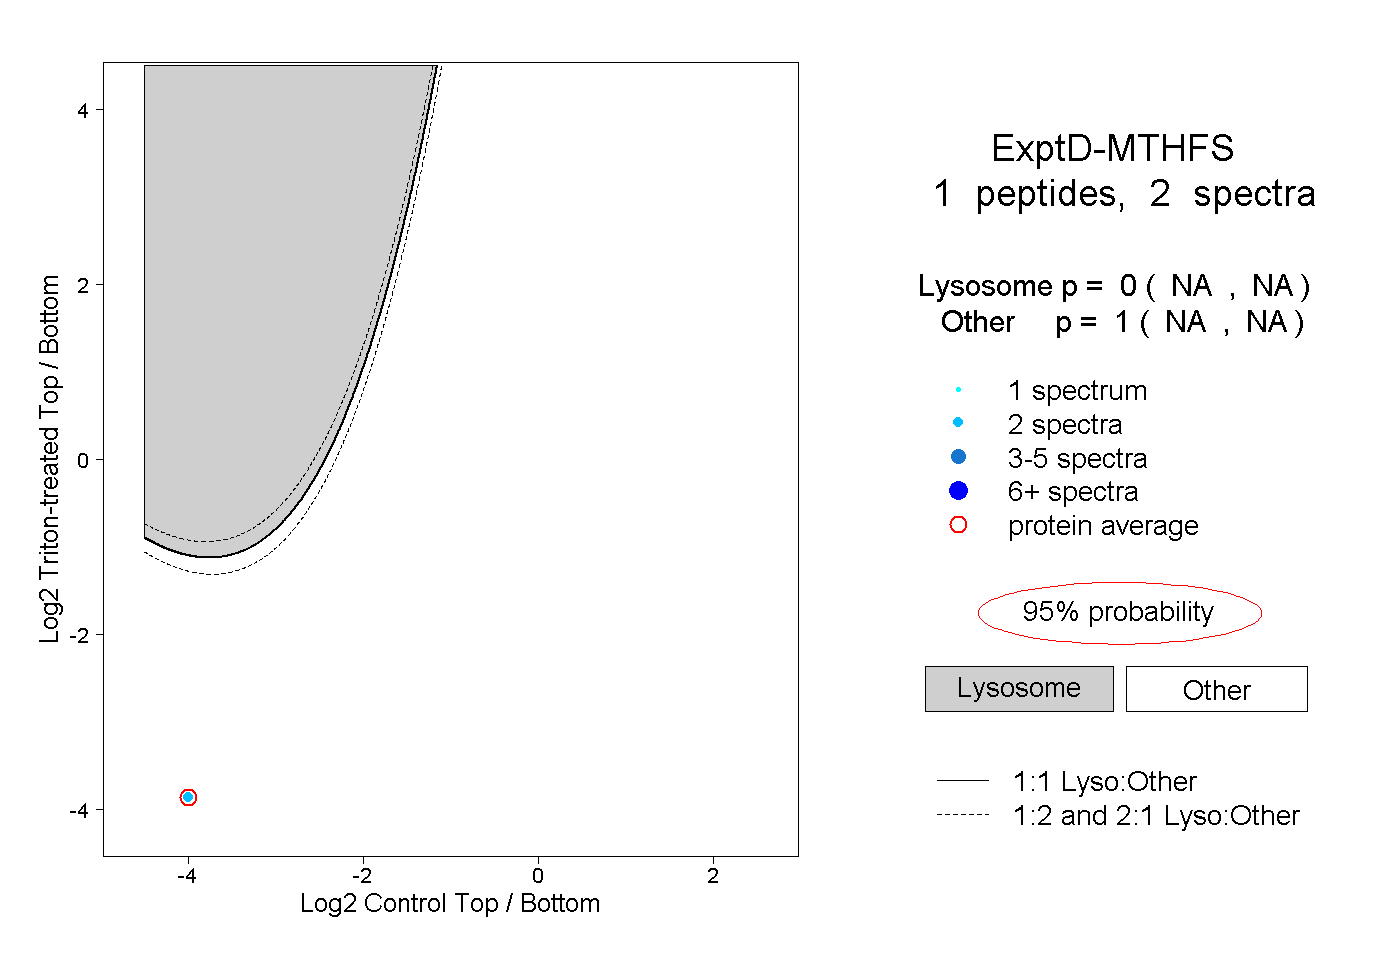 |
0.000 NA | NA |
1.000 NA | NA |