 6
6peptides
spectra
0.000 | 0.000
0.000 | 0.012
0.000 | 0.023
0.000 | 0.206
0.000 | 0.206
0.000 | 0.047
0.674 | 0.815
0.000 | 0.048
4peptides
spectra
0.000 | 0.000
1.000 | 1.000
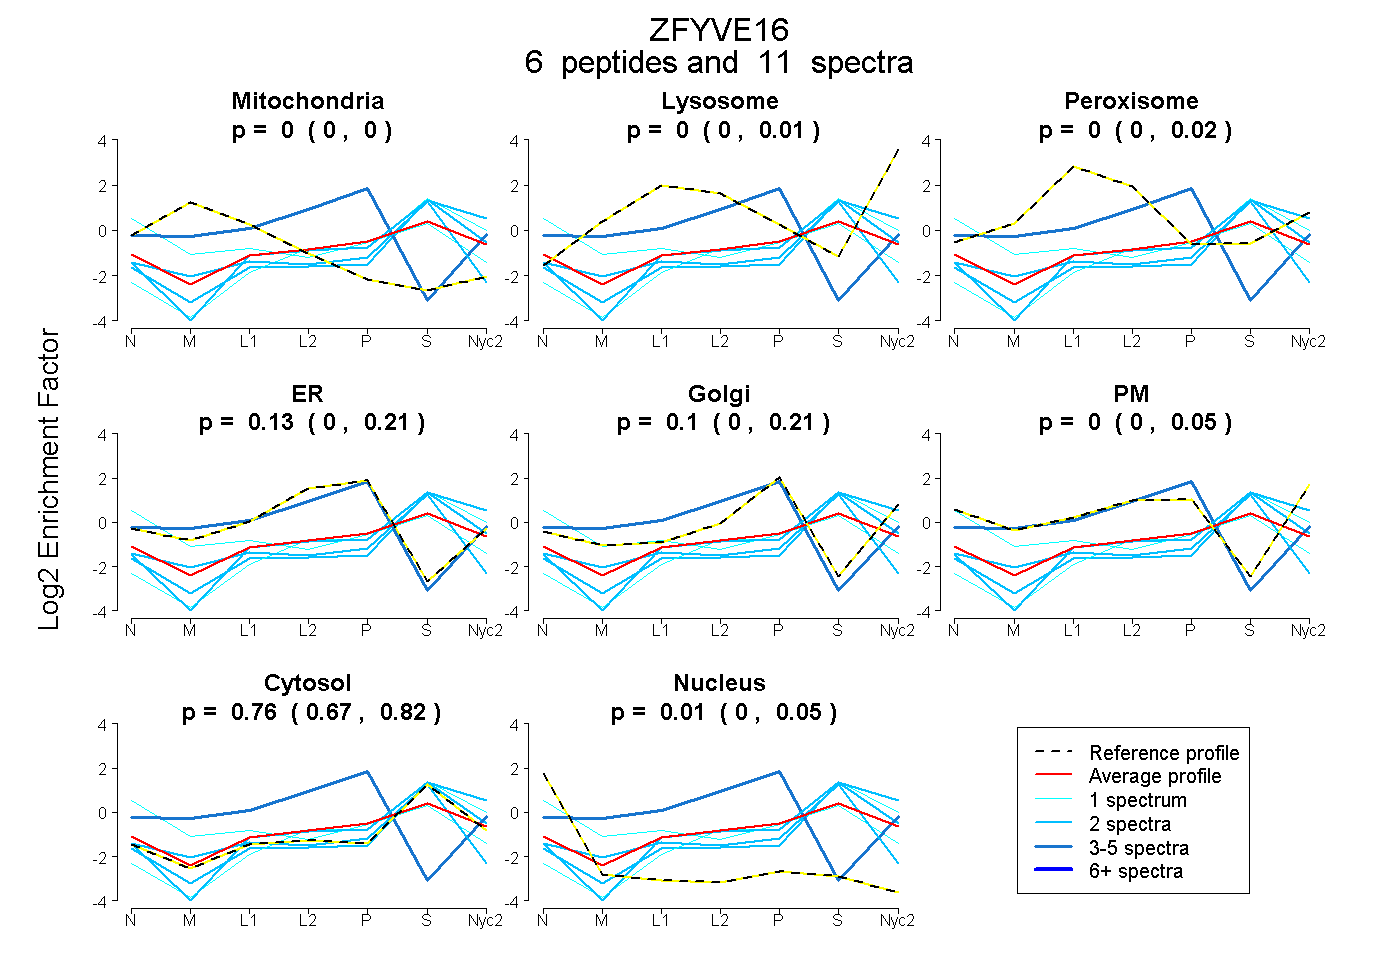
| Plot | Mito | Lyso | Perox | ER | Golgi | PM | Cytosol | Nucleus | |||||
| Expt A |
6 peptides |
11 spectra |
|
0.000 0.000 | 0.000 |
0.000 0.000 | 0.012 |
0.000 0.000 | 0.023 |
0.129 0.000 | 0.206 |
0.101 0.000 | 0.206 |
0.000 0.000 | 0.047 |
0.764 0.674 | 0.815 |
0.006 0.000 | 0.048 |
||
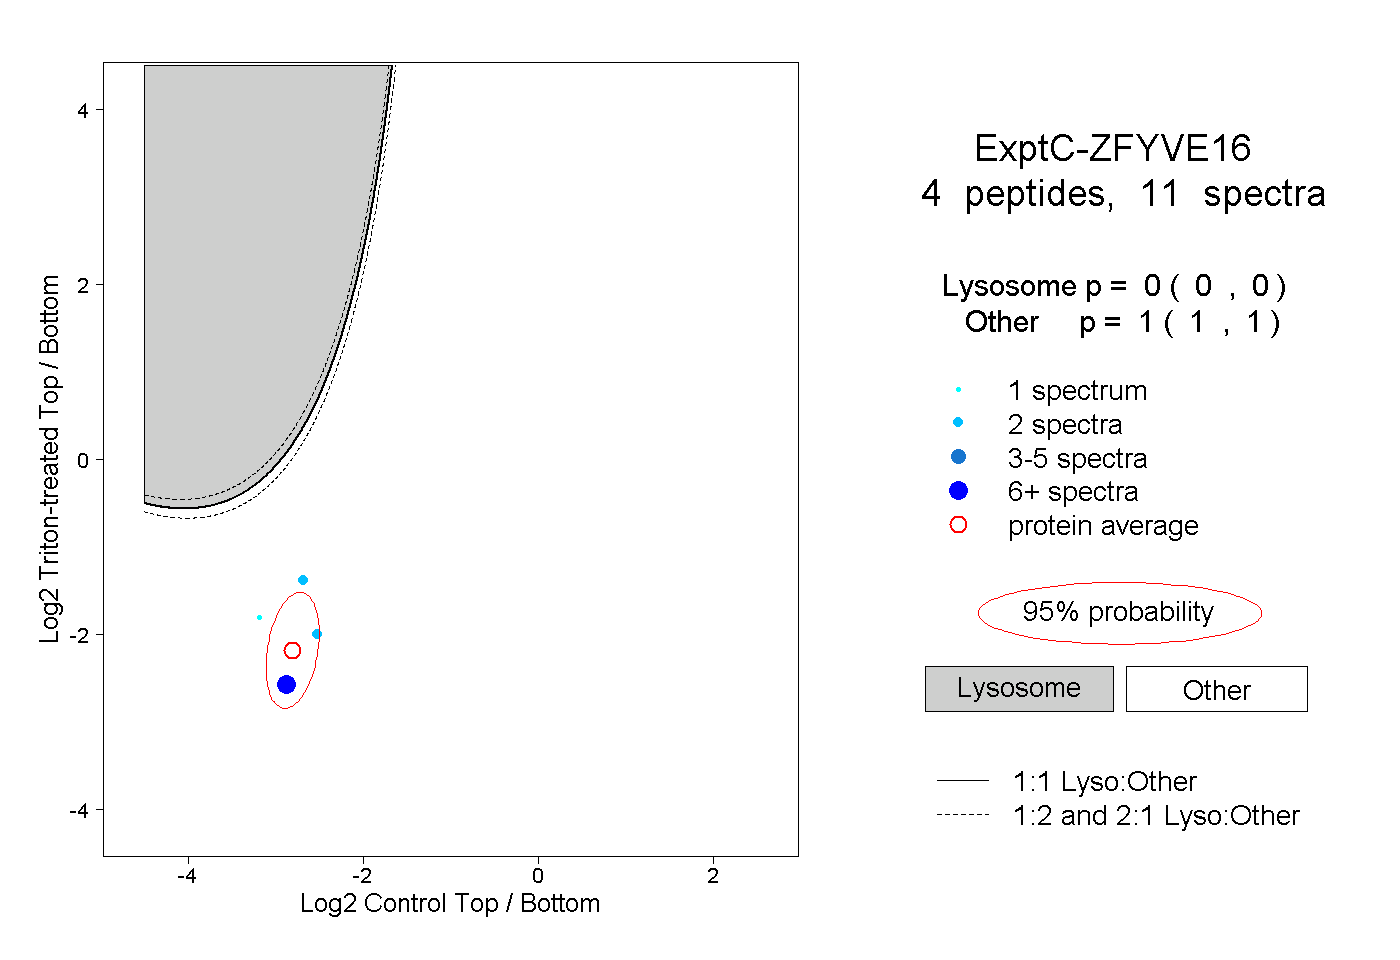
| Plot | Lyso | Other | |||||||||||
| Expt C |
4 peptides |
11 spectra |
|
0.000 0.000 | 0.000 |
1.000 1.000 | 1.000 |