 6
6peptides
spectra
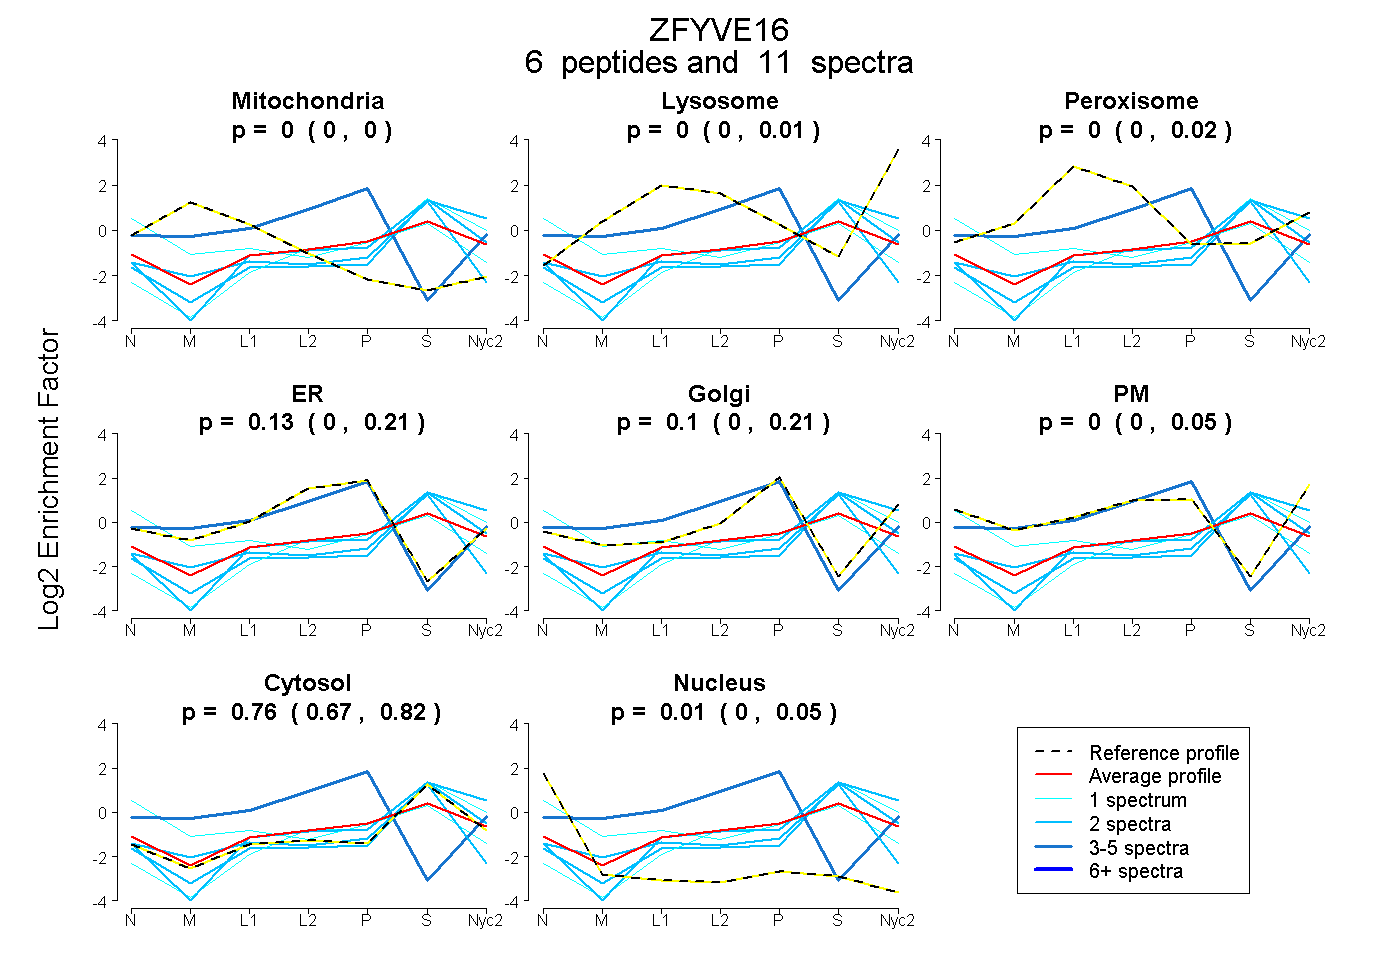
0.000 | 0.000
0.000 | 0.012
0.000 | 0.023
0.000 | 0.206
0.000 | 0.206
0.000 | 0.047
0.674 | 0.815
0.000 | 0.048
| Plot | Mito | Lyso | Perox | ER | Golgi | PM | Cytosol | Nucleus | |||||
| Expt A |
6 peptides |
11 spectra |
|
0.000 0.000 | 0.000 |
0.000 0.000 | 0.012 |
0.000 0.000 | 0.023 |
0.129 0.000 | 0.206 |
0.101 0.000 | 0.206 |
0.000 0.000 | 0.047 |
0.764 0.674 | 0.815 |
0.006 0.000 | 0.048 |
| 2 spectra, SPFLCGILIHK | 0.065 | 0.000 | 0.000 | 0.000 | 0.000 | 0.000 | 0.868 | 0.067 | ||
| 3 spectra, DSYFK | 0.086 | 0.000 | 0.000 | 0.752 | 0.129 | 0.033 | 0.000 | 0.000 | ||
| 2 spectra, QPNVEGPCSR | 0.000 | 0.084 | 0.000 | 0.000 | 0.000 | 0.000 | 0.916 | 0.000 | ||
| 2 spectra, AYPAPLTSVR | 0.000 | 0.000 | 0.000 | 0.000 | 0.000 | 0.000 | 1.000 | 0.000 | ||
| 1 spectrum, LLDDFEQNPEK | 0.000 | 0.004 | 0.000 | 0.000 | 0.006 | 0.000 | 0.989 | 0.000 | ||
| 1 spectrum, DSPQYQR | 0.050 | 0.000 | 0.193 | 0.000 | 0.089 | 0.010 | 0.440 | 0.218 |
| Plot | Lyso | Other | |||||||||||
| Expt C |
4 peptides |
11 spectra |
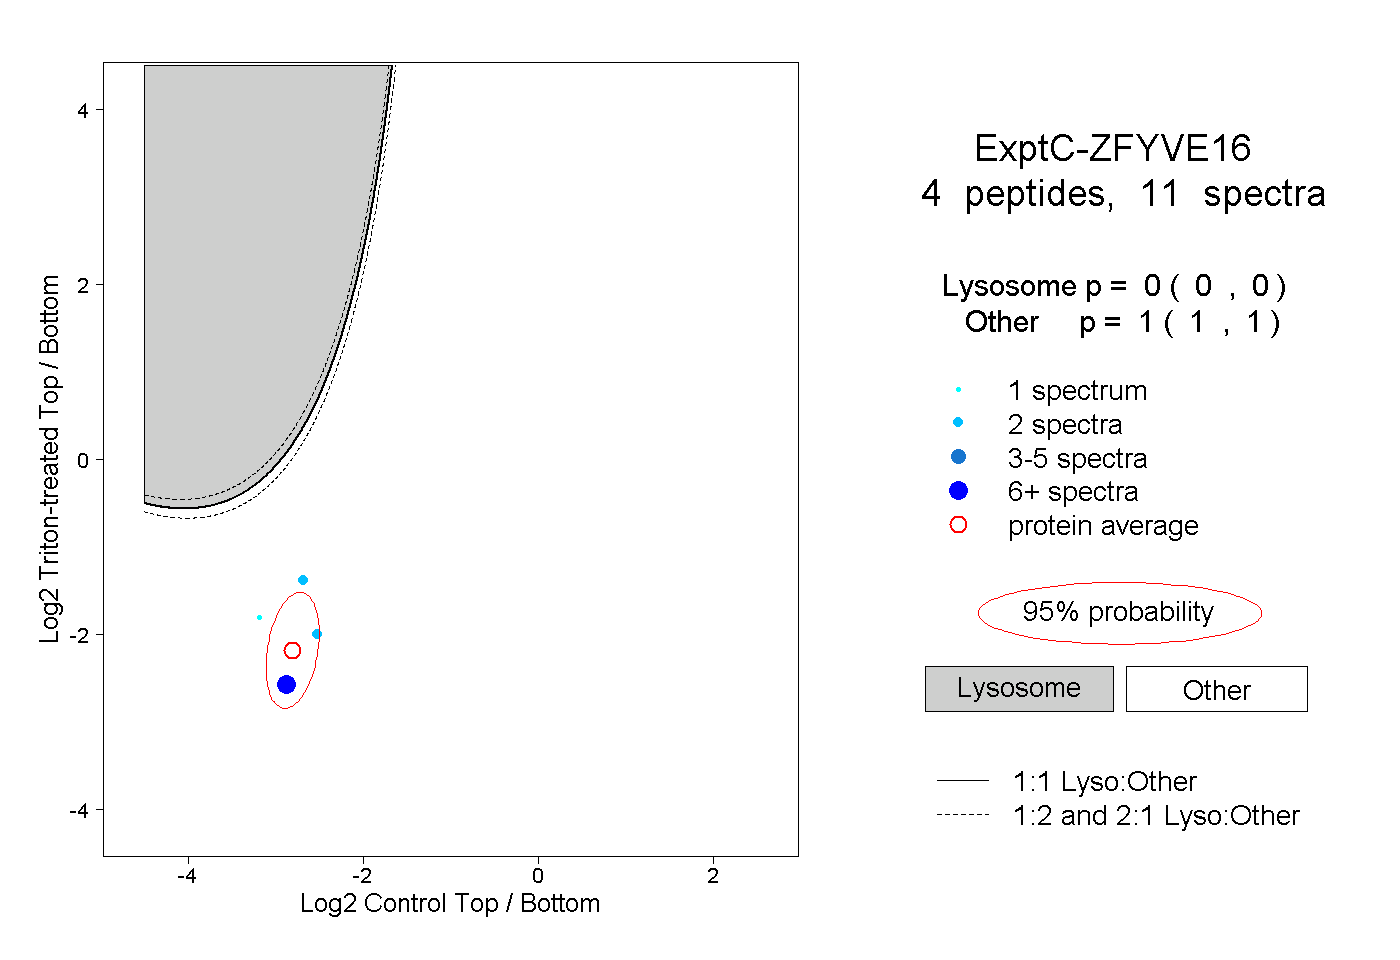 |
0.000 0.000 | 0.000 |
1.000 1.000 | 1.000 |