 8
8peptides
spectra
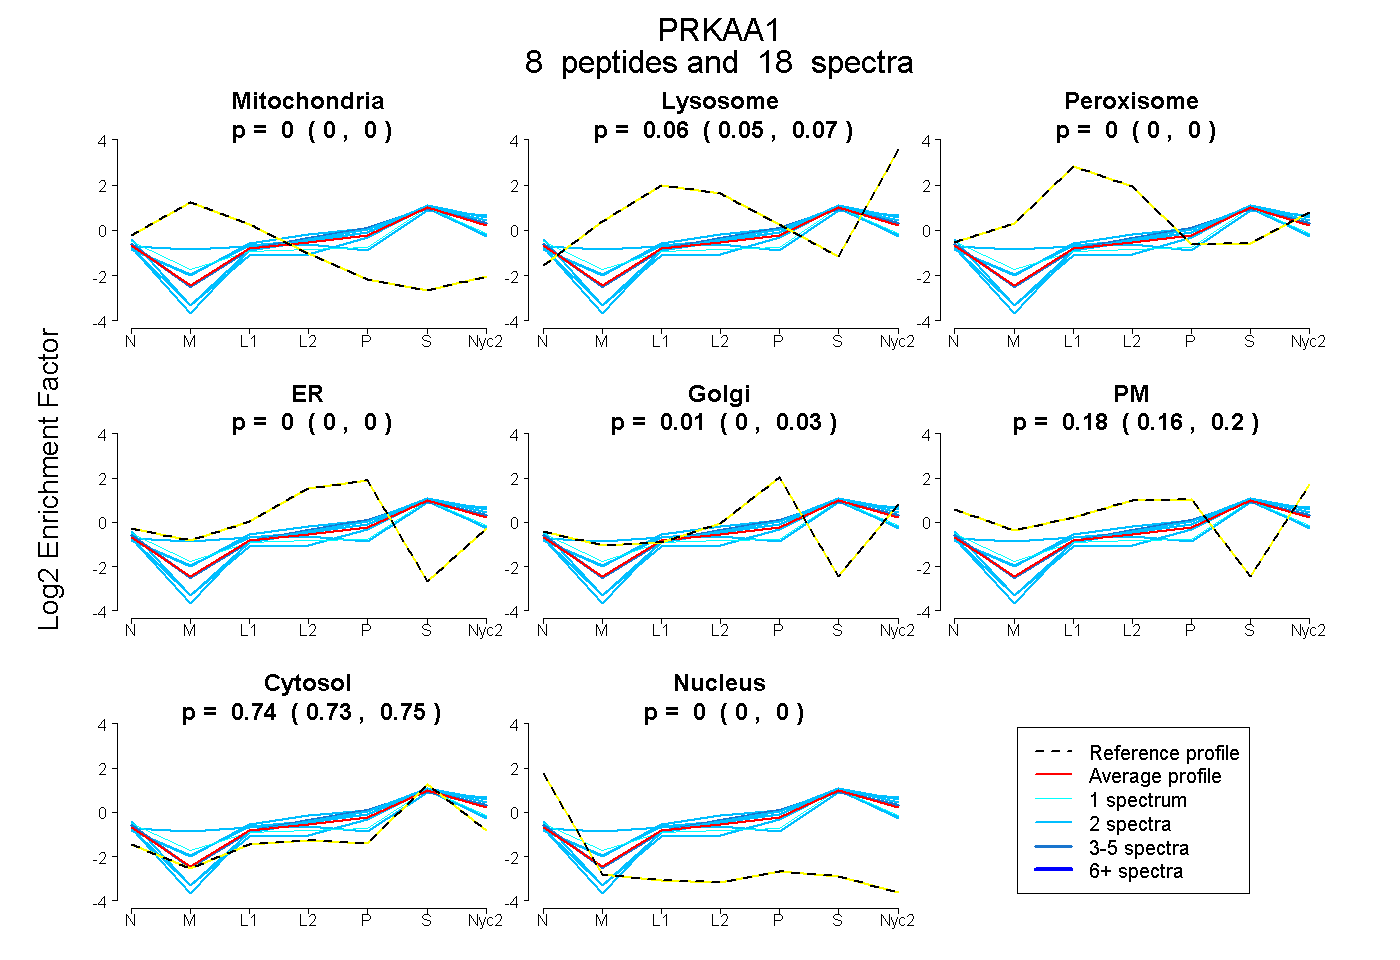
0.000 | 0.000
0.051 | 0.073
0.000 | 0.000
0.000 | 0.000
0.000 | 0.032
0.160 | 0.197
0.731 | 0.751
0.000 | 0.000
3peptides
spectra
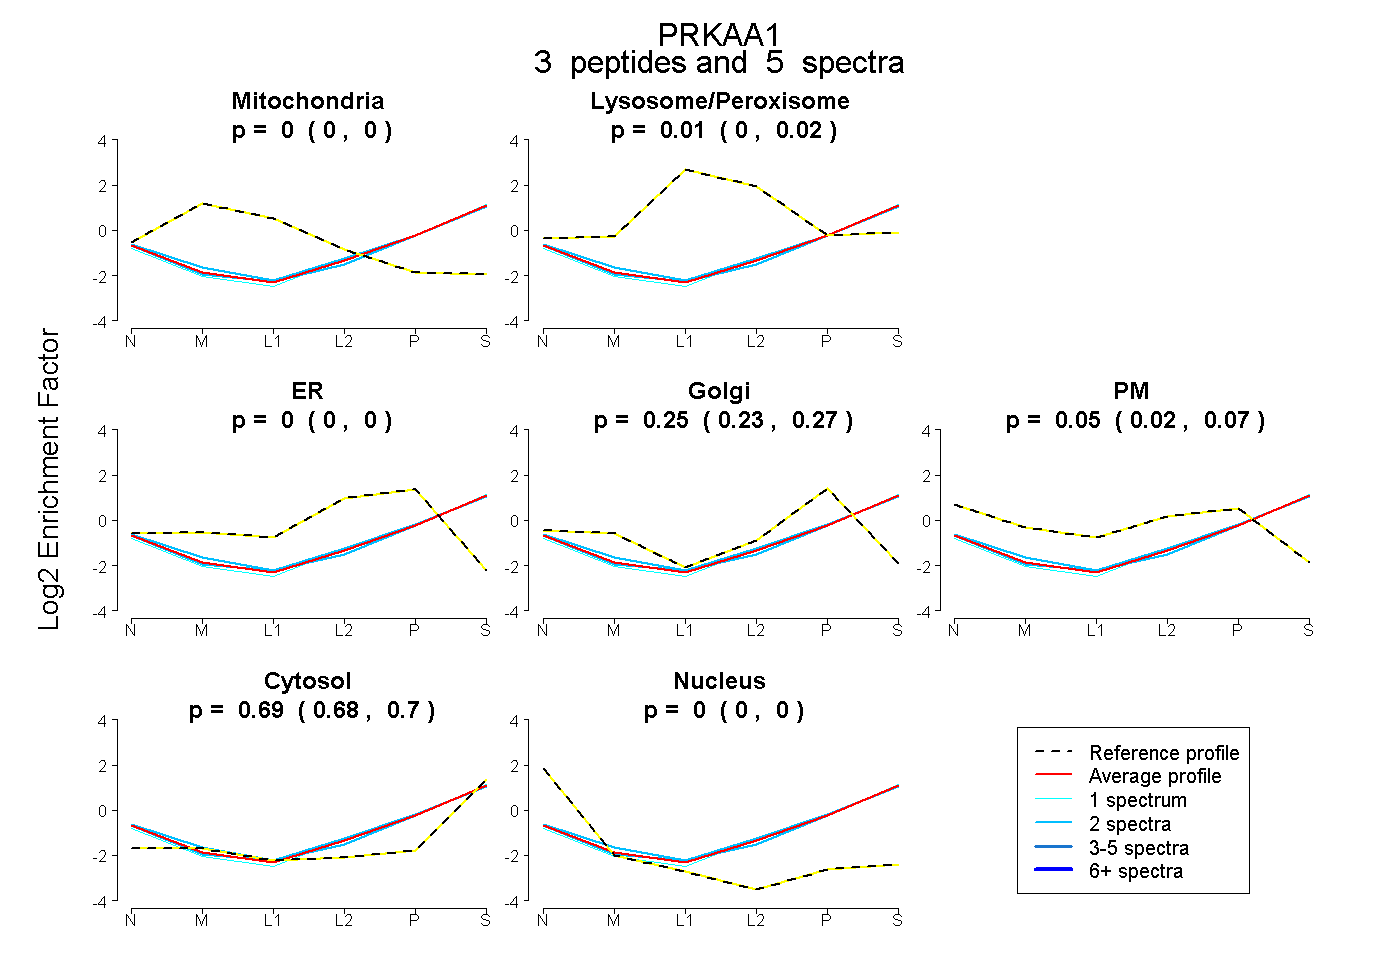
0.000 | 0.000
0.000 | 0.022
0.000 | 0.000
0.232 | 0.266
0.025 | 0.073
0.681 | 0.696
0.000 | 0.000
6peptides
spectra
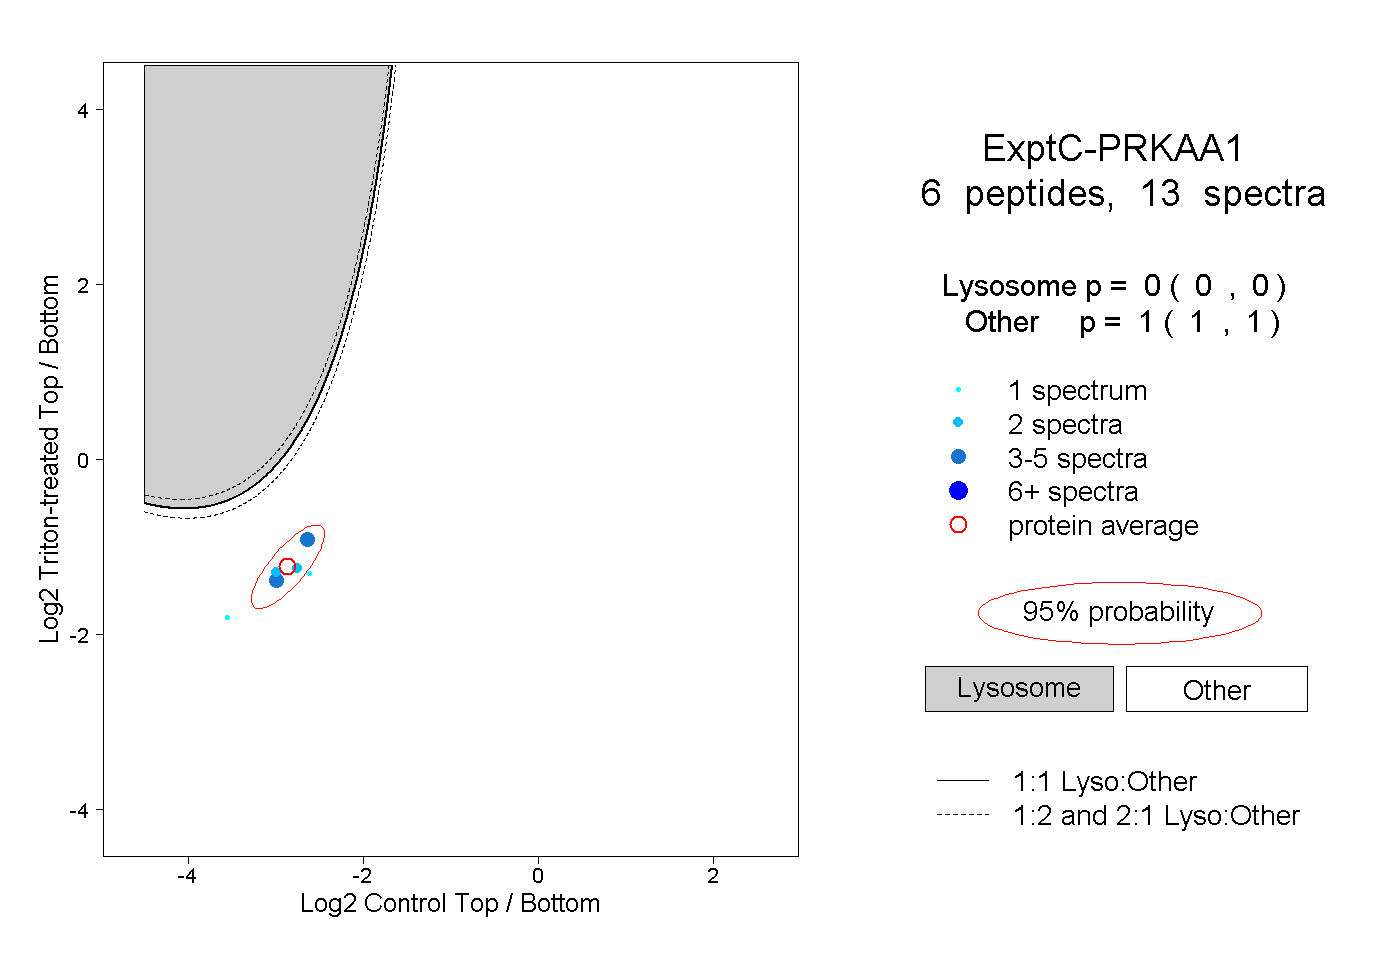
0.000 | 0.000
1.000 | 1.000