 8
8peptides
spectra
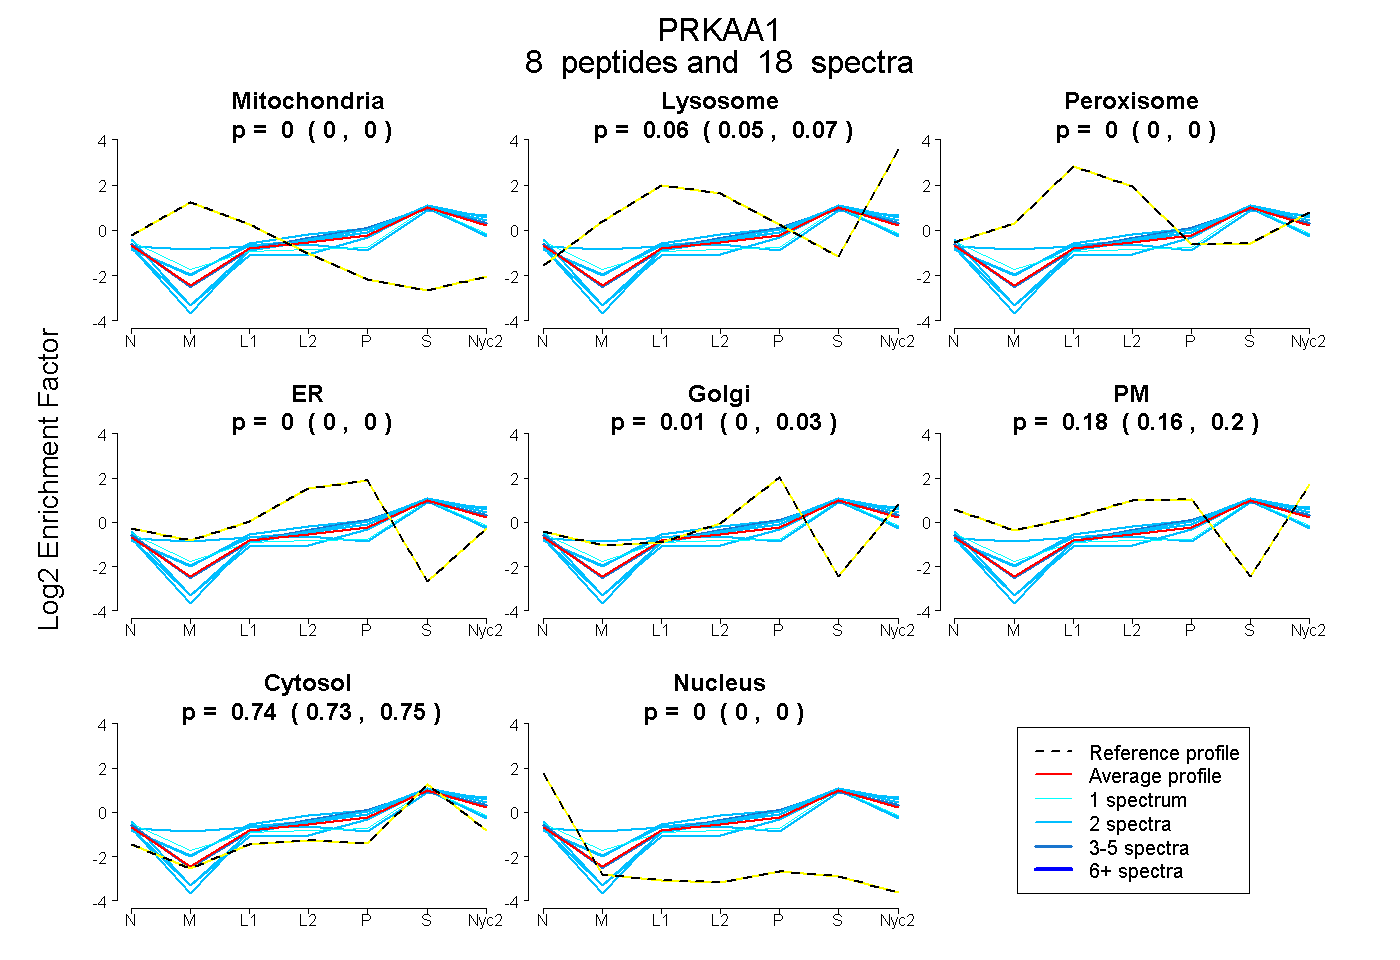
0.000 | 0.000
0.051 | 0.073
0.000 | 0.000
0.000 | 0.000
0.000 | 0.032
0.160 | 0.197
0.731 | 0.751
0.000 | 0.000
| Plot | Mito | Lyso | Perox | ER | Golgi | PM | Cytosol | Nucleus | |||||
| Expt A |
8 peptides |
18 spectra |
|
0.000 0.000 | 0.000 |
0.063 0.051 | 0.073 |
0.000 0.000 | 0.000 |
0.000 0.000 | 0.000 |
0.011 0.000 | 0.032 |
0.185 0.160 | 0.197 |
0.742 0.731 | 0.751 |
0.000 0.000 | 0.000 |
| 1 spectrum, YLFPEDPSYSSTMIDDEALK | 0.000 | 0.000 | 0.060 | 0.000 | 0.000 | 0.176 | 0.764 | 0.000 | ||
| 2 spectra, SIDDEITEAK | 0.000 | 0.089 | 0.000 | 0.000 | 0.114 | 0.048 | 0.749 | 0.000 | ||
| 2 spectra, MSLQLYQVDSR | 0.000 | 0.141 | 0.018 | 0.000 | 0.084 | 0.067 | 0.689 | 0.000 | ||
| 5 spectra, SGTATPQR | 0.000 | 0.065 | 0.000 | 0.000 | 0.088 | 0.154 | 0.693 | 0.000 | ||
| 2 spectra, SGSISNYR | 0.000 | 0.000 | 0.000 | 0.000 | 0.137 | 0.035 | 0.827 | 0.000 | ||
| 2 spectra, VPFLVAETPR | 0.000 | 0.058 | 0.000 | 0.000 | 0.154 | 0.032 | 0.756 | 0.000 | ||
| 2 spectra, NHQDPLAVAYHLIIDNR | 0.037 | 0.252 | 0.000 | 0.000 | 0.000 | 0.060 | 0.651 | 0.000 | ||
| 2 spectra, HELTGHK | 0.000 | 0.044 | 0.093 | 0.162 | 0.035 | 0.000 | 0.666 | 0.000 |
| Plot | Mito | Lyso or Perox | ER | Golgi | PM | Cytosol | Nucleus | ||||||
| Expt B |
3 peptides |
5 spectra |
 |
0.000 0.000 | 0.000 |
0.008 0.000 | 0.022 |
0.000 0.000 | 0.000 |
0.249 0.232 | 0.266 |
0.053 0.025 | 0.073 |
0.689 0.681 | 0.696 |
0.000 0.000 | 0.000 |
|||
| Plot | Lyso | Other | |||||||||||
| Expt C |
6 peptides |
13 spectra |
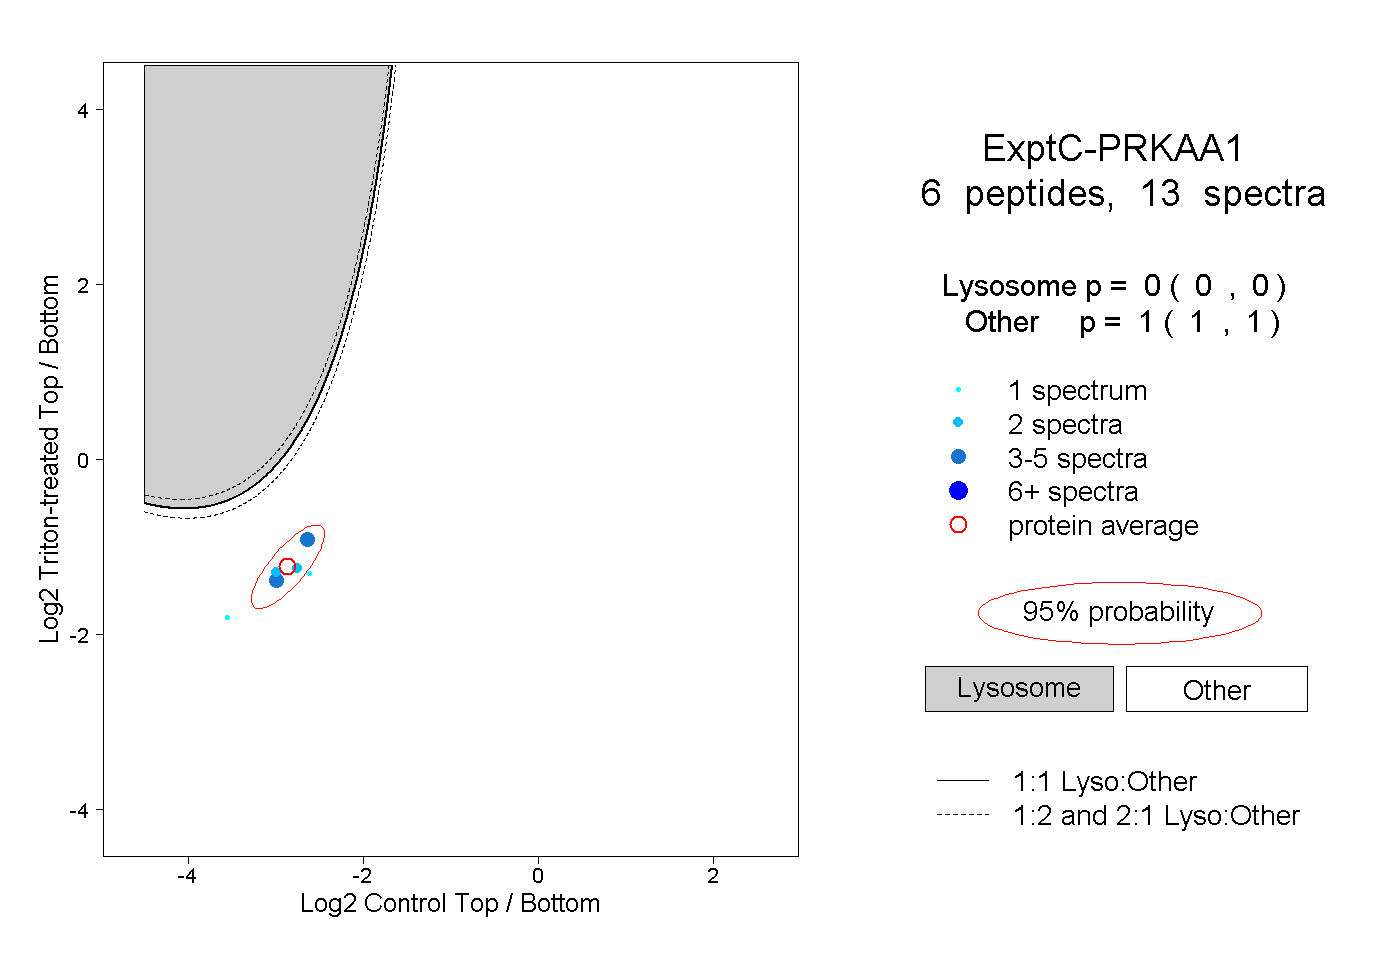 |
0.000 0.000 | 0.000 |
1.000 1.000 | 1.000 |