 13
13peptides
spectra
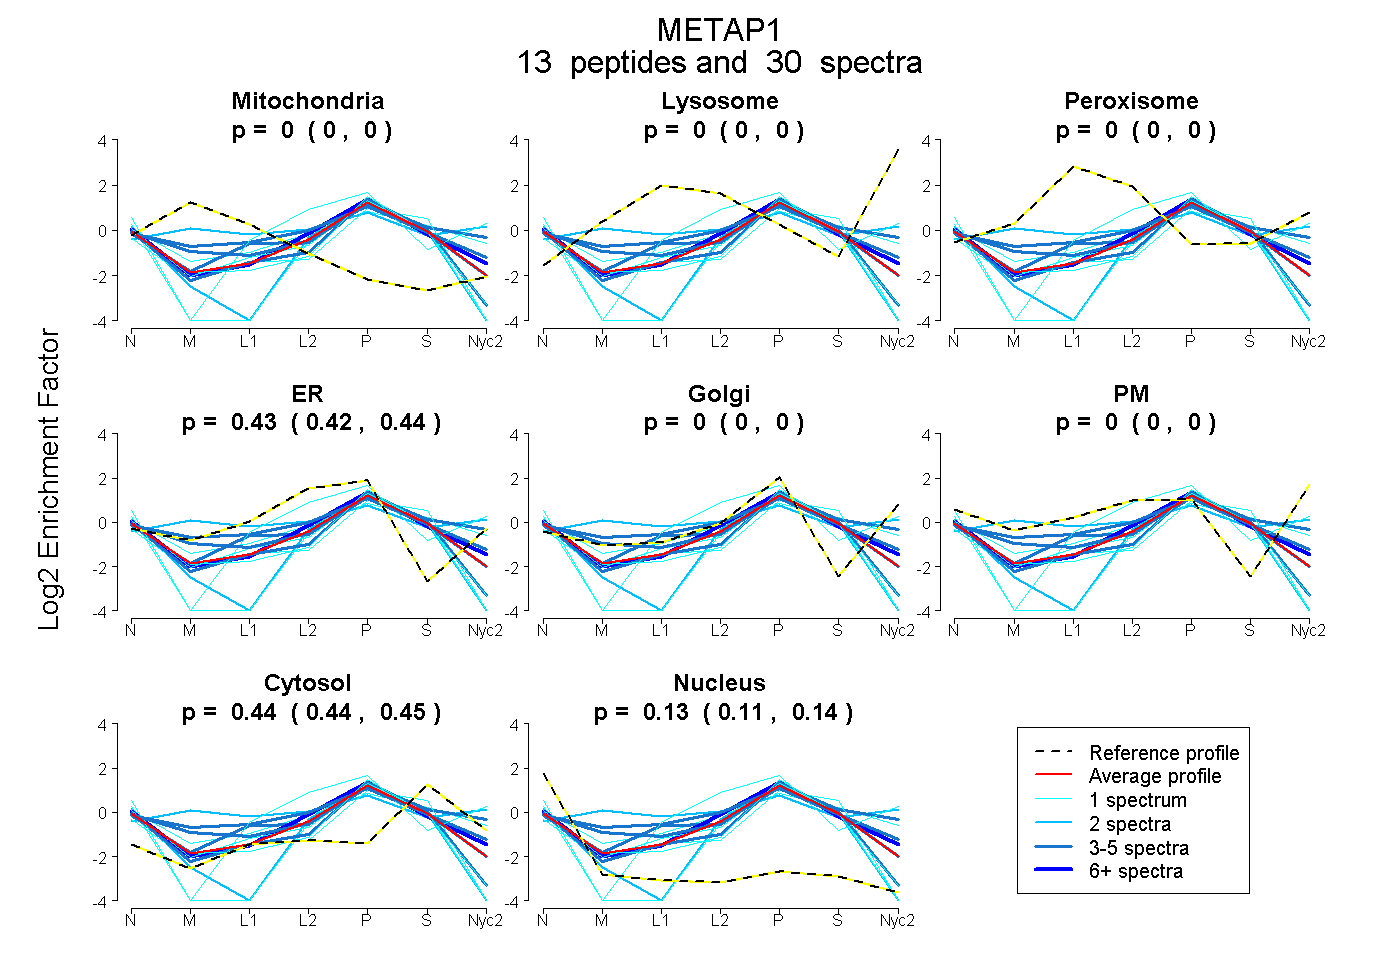
0.000 | 0.000
0.000 | 0.000
0.000 | 0.000
0.420 | 0.437
0.000 | 0.000
0.000 | 0.000
0.436 | 0.451
0.115 | 0.136
4peptides
spectra
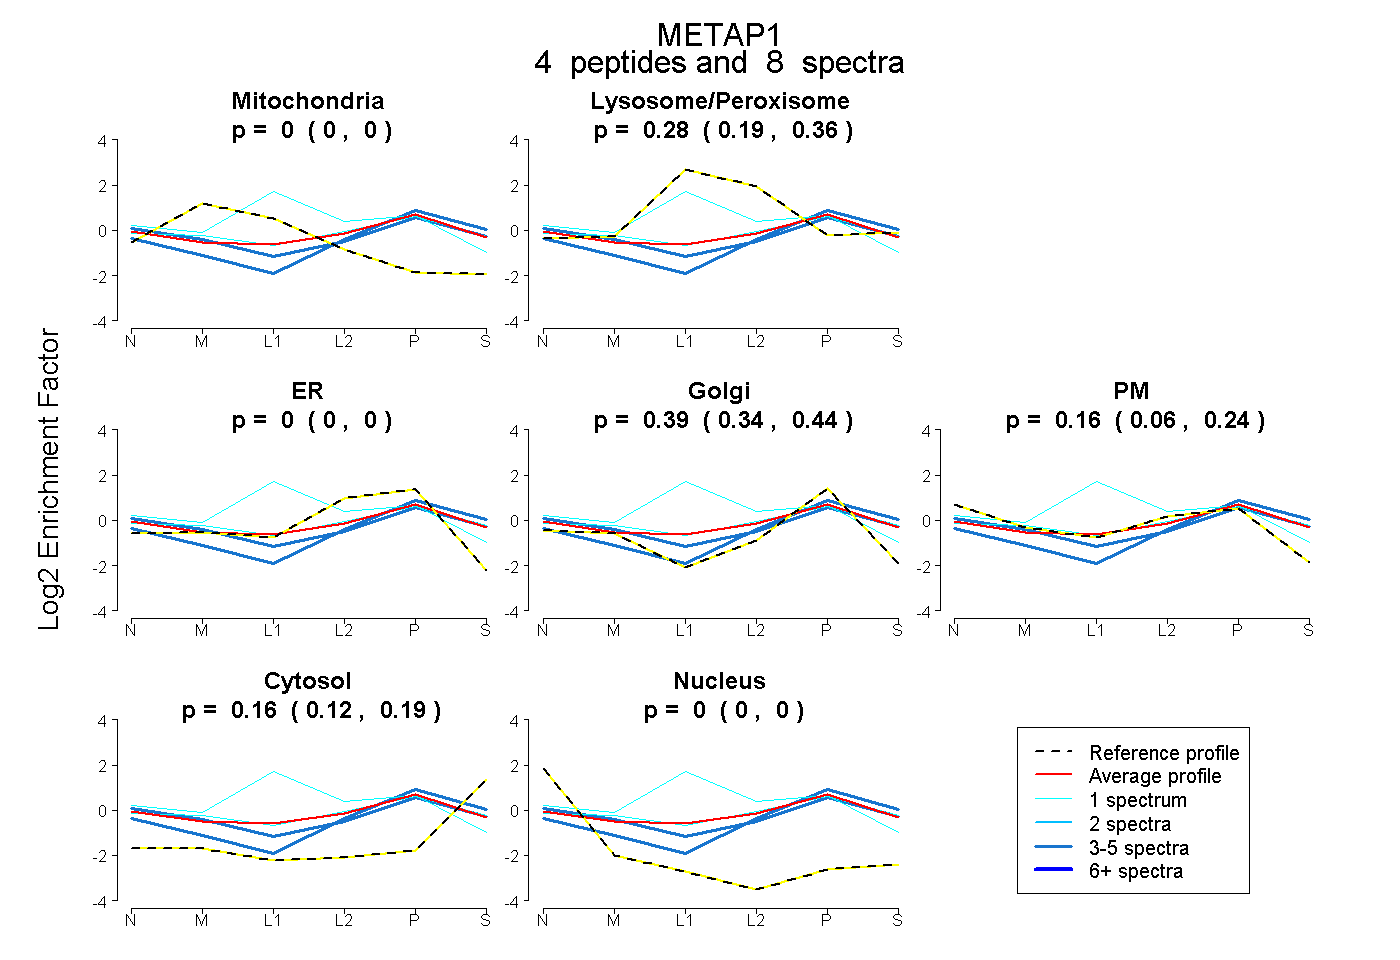
0.000 | 0.000
0.187 | 0.361
0.000 | 0.000
0.337 | 0.440
0.063 | 0.243
0.124 | 0.190
0.000 | 0.000
4peptides
spectra
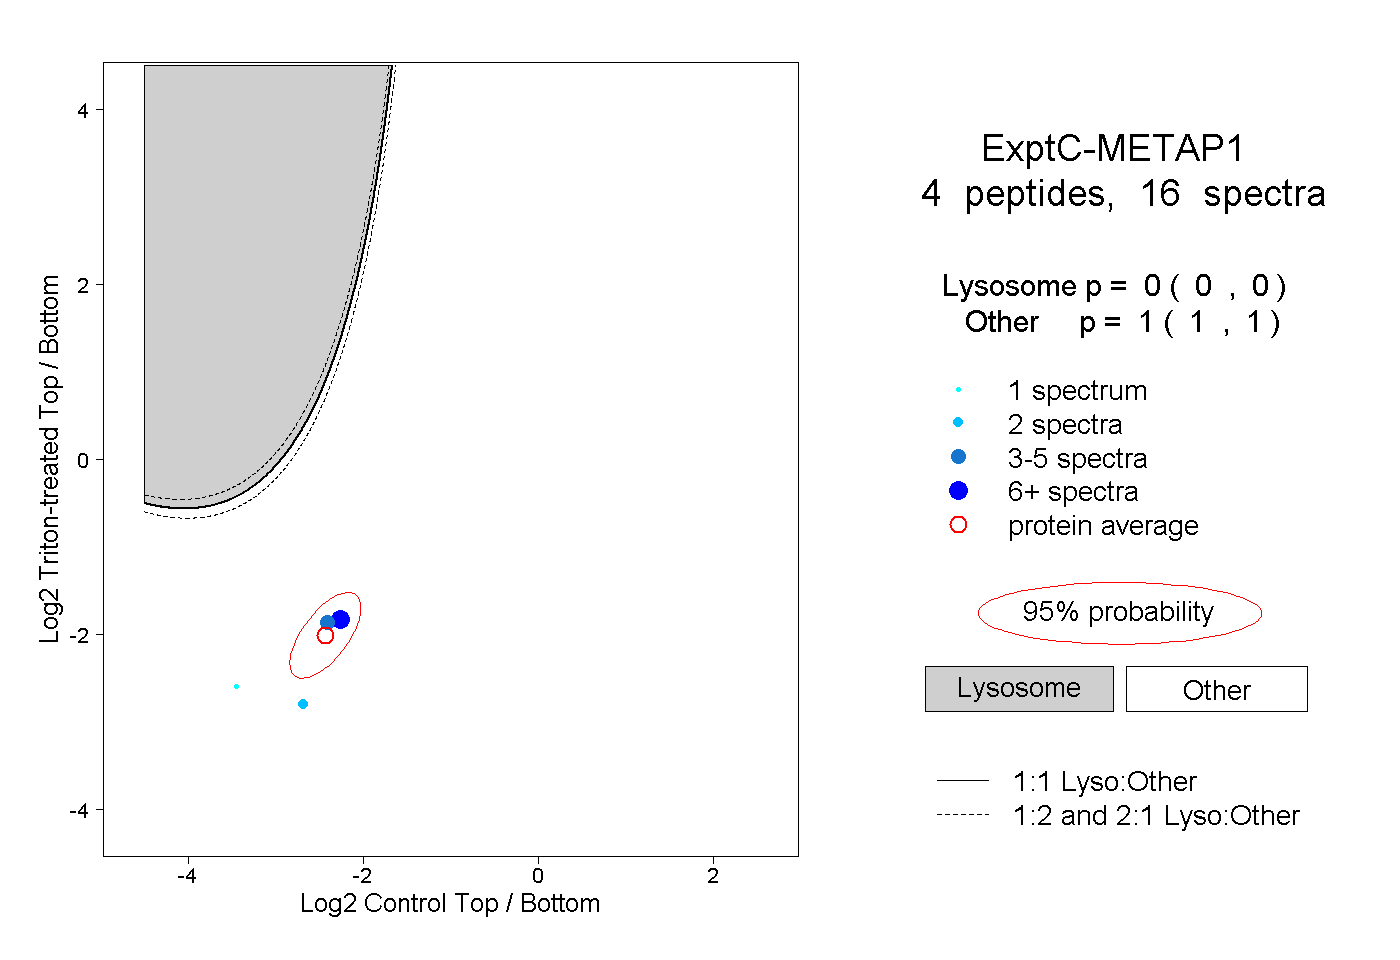
0.000 | 0.000
1.000 | 1.000
4peptides
spectra
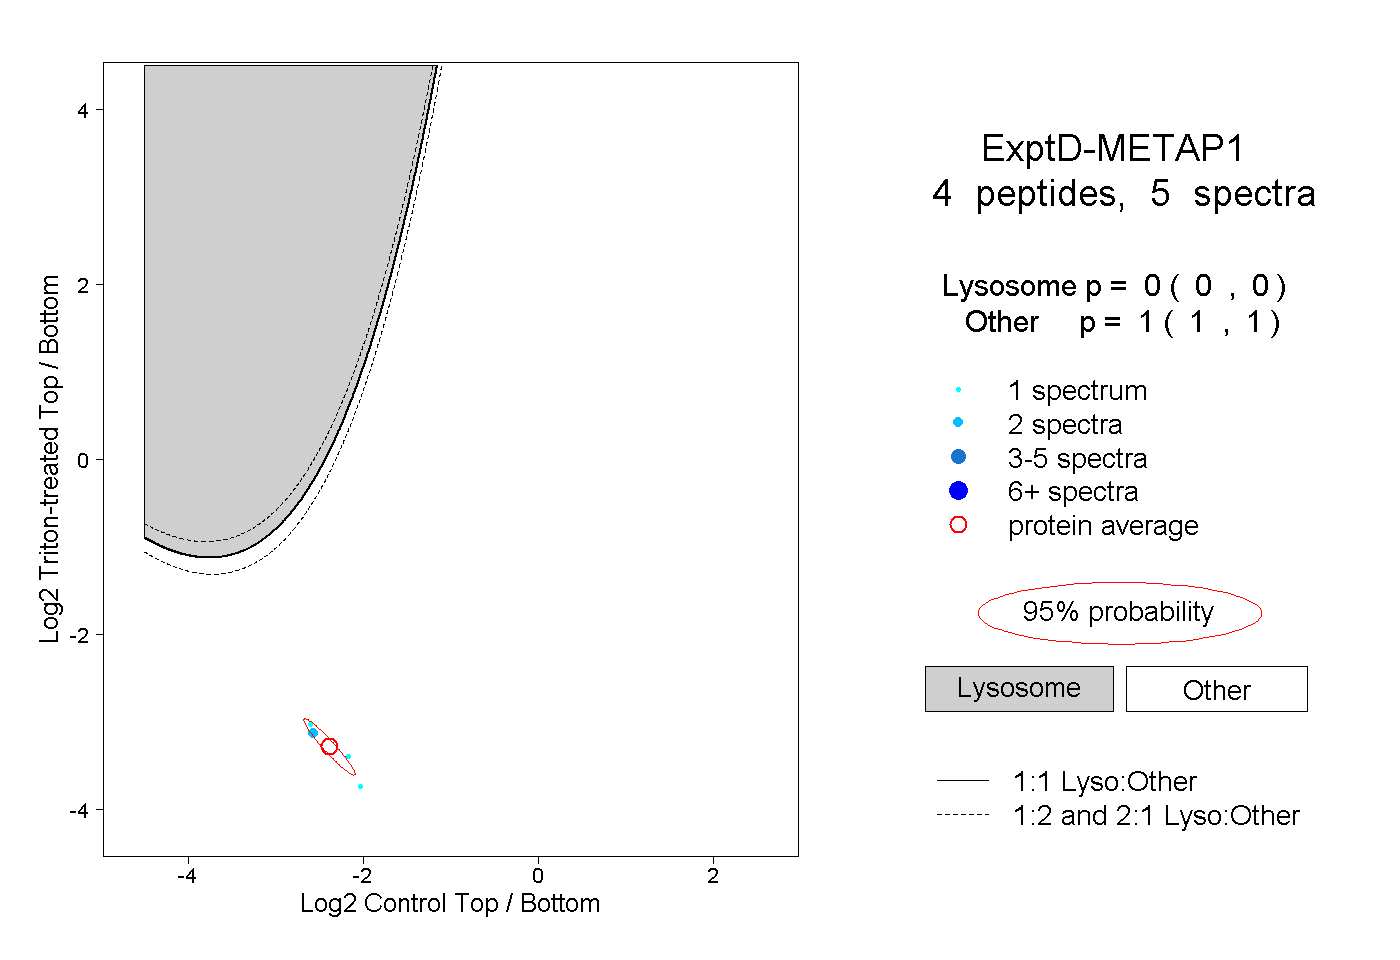
0.000 | 0.000
1.000 | 1.000