 13
13peptides
spectra
0.000 | 0.000
0.000 | 0.000
0.000 | 0.000
0.420 | 0.437
0.000 | 0.000
0.000 | 0.000
0.436 | 0.451
0.115 | 0.136
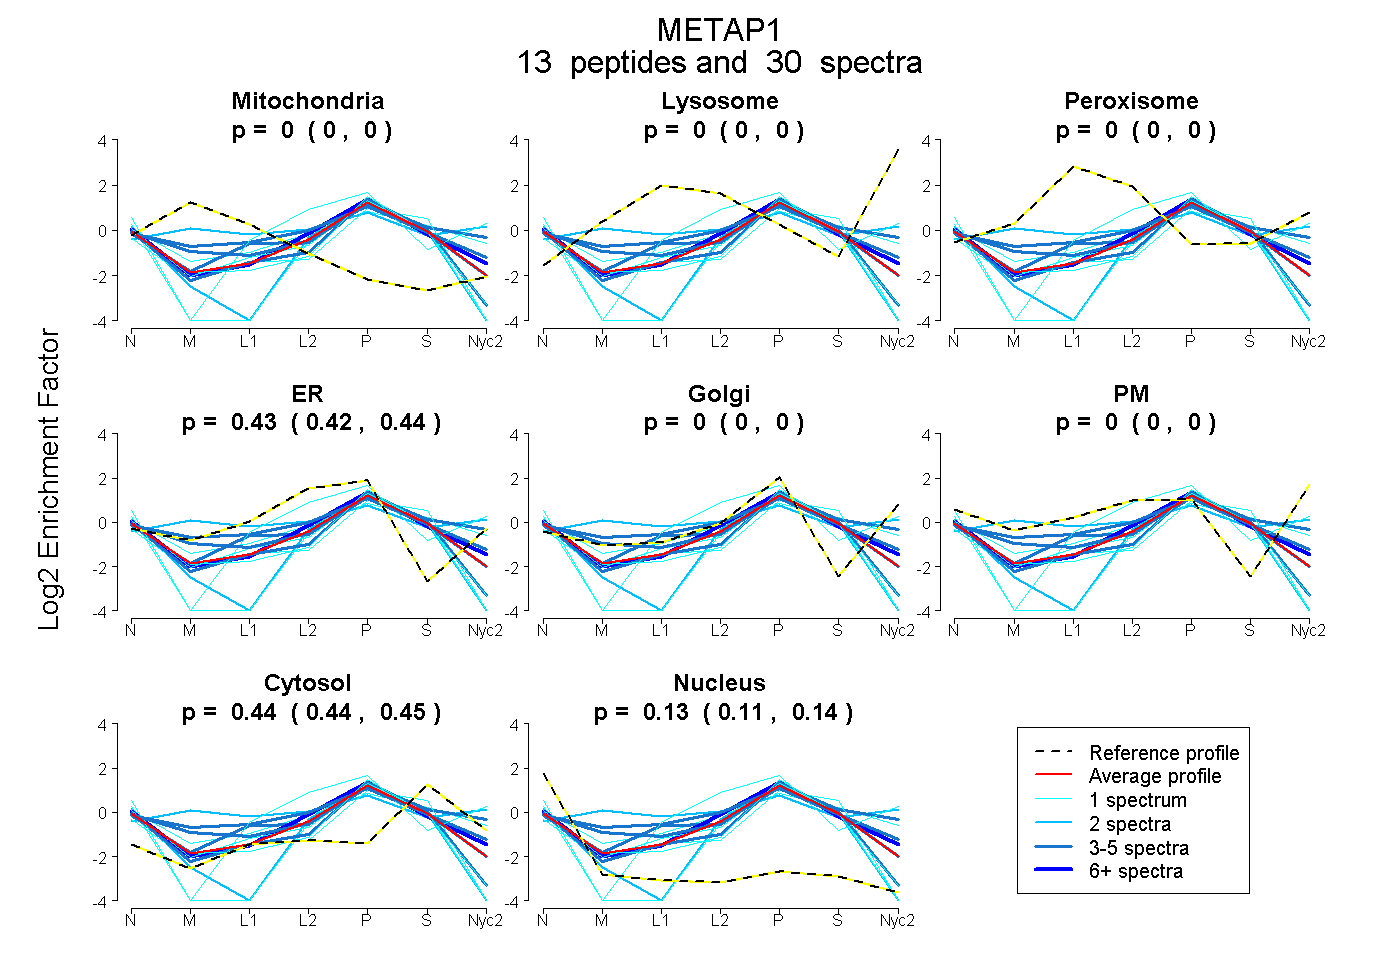
| Plot | Mito | Lyso | Perox | ER | Golgi | PM | Cytosol | Nucleus | |||||
| Expt A |
13 peptides |
30 spectra |
|
0.000 0.000 | 0.000 |
0.000 0.000 | 0.000 |
0.000 0.000 | 0.000 |
0.429 0.420 | 0.437 |
0.000 0.000 | 0.000 |
0.000 0.000 | 0.000 |
0.444 0.436 | 0.451 |
0.127 0.115 | 0.136 |
| 4 spectra, LQCPTCIK | 0.000 | 0.000 | 0.000 | 0.341 | 0.000 | 0.000 | 0.419 | 0.240 | ||
| 2 spectra, HAQANGFSVVR | 0.049 | 0.000 | 0.291 | 0.000 | 0.422 | 0.000 | 0.237 | 0.000 | ||
| 1 spectrum, EVLDIAAGMIK | 0.000 | 0.000 | 0.000 | 0.186 | 0.000 | 0.000 | 0.402 | 0.412 | ||
| 4 spectra, SCCTSVNEVICHGIPDR | 0.000 | 0.000 | 0.000 | 0.469 | 0.000 | 0.000 | 0.422 | 0.109 | ||
| 1 spectrum, SAQFEHTLLVTDTGCEILTR | 0.000 | 0.000 | 0.000 | 0.450 | 0.218 | 0.005 | 0.327 | 0.000 | ||
| 1 spectrum, LGIQGSYFCSQECFK | 0.000 | 0.000 | 0.000 | 0.228 | 0.000 | 0.000 | 0.521 | 0.251 | ||
| 1 spectrum, GSWATHK | 0.000 | 0.000 | 0.000 | 0.311 | 0.121 | 0.058 | 0.510 | 0.000 | ||
| 2 spectra, AGVTTEEIDHAVHLACIAR | 0.000 | 0.000 | 0.000 | 0.255 | 0.000 | 0.000 | 0.354 | 0.392 | ||
| 1 spectrum, VCETDGCSSEAK | 0.000 | 0.000 | 0.000 | 0.353 | 0.000 | 0.000 | 0.384 | 0.263 | ||
| 3 spectra, NGYHGDLNETFFVGDVDEGAR | 0.059 | 0.000 | 0.000 | 0.524 | 0.000 | 0.000 | 0.418 | 0.000 | ||
| 6 spectra, LLSSEDIEGMR | 0.000 | 0.000 | 0.000 | 0.413 | 0.076 | 0.000 | 0.424 | 0.087 | ||
| 1 spectrum, NCYPSPLNYYNFPK | 0.000 | 0.000 | 0.000 | 0.370 | 0.000 | 0.000 | 0.357 | 0.273 | ||
| 3 spectra, LFHTAPNVPHYAK | 0.000 | 0.000 | 0.013 | 0.153 | 0.366 | 0.000 | 0.468 | 0.000 |
| Plot | Mito | Lyso or Perox | ER | Golgi | PM | Cytosol | Nucleus | ||||||
| Expt B |
4 peptides |
8 spectra |
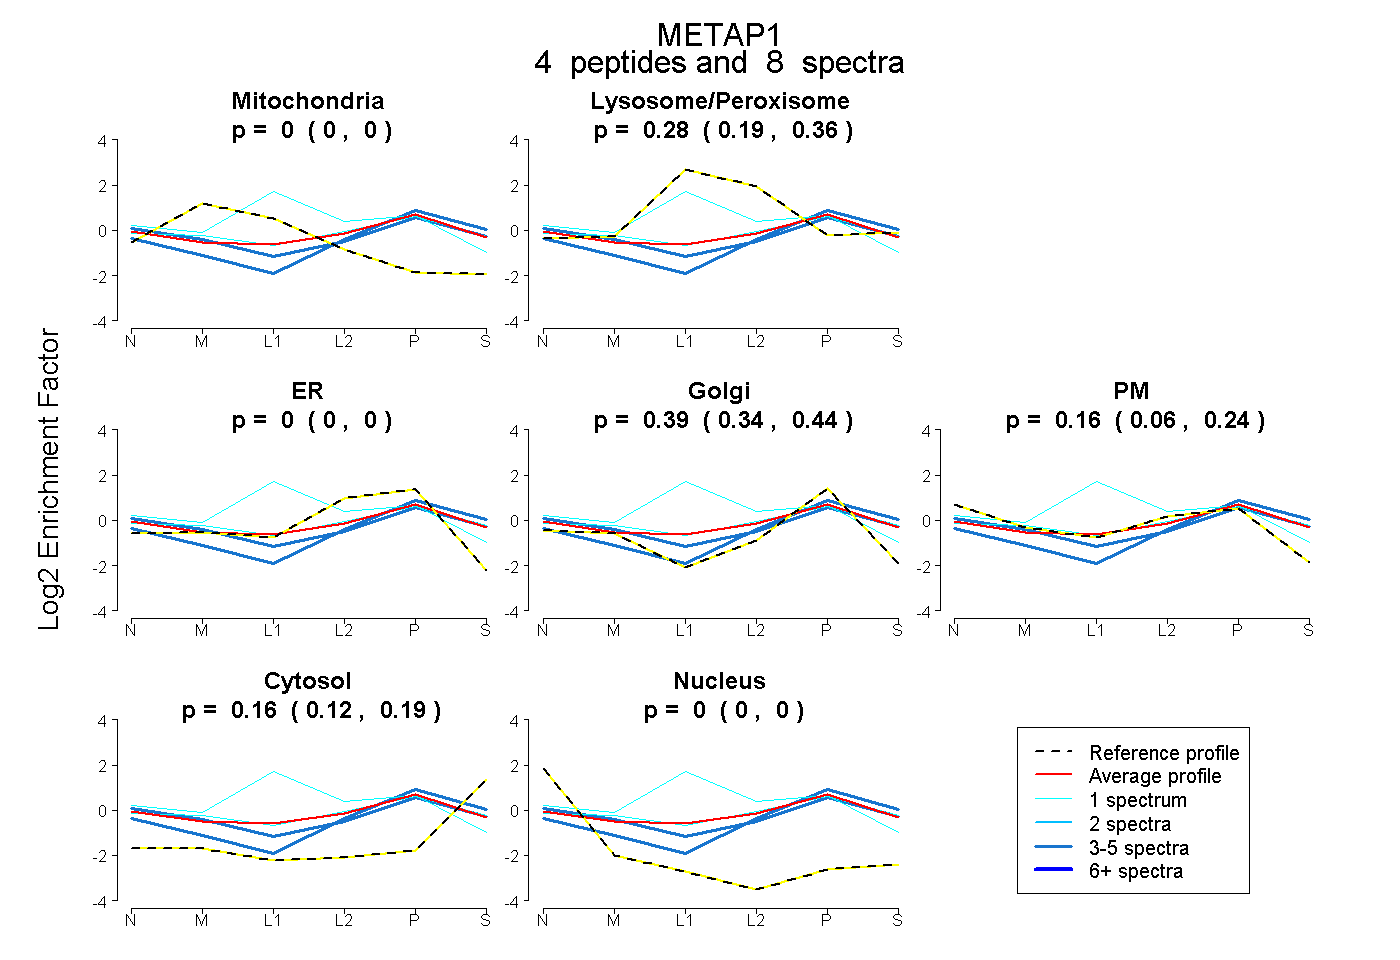 |
0.000 0.000 | 0.000 |
0.284 0.187 | 0.361 |
0.000 0.000 | 0.000 |
0.394 0.337 | 0.440 |
0.161 0.063 | 0.243 |
0.161 0.124 | 0.190 |
0.000 0.000 | 0.000 |
|||
| Plot | Lyso | Other | |||||||||||
| Expt C |
4 peptides |
16 spectra |
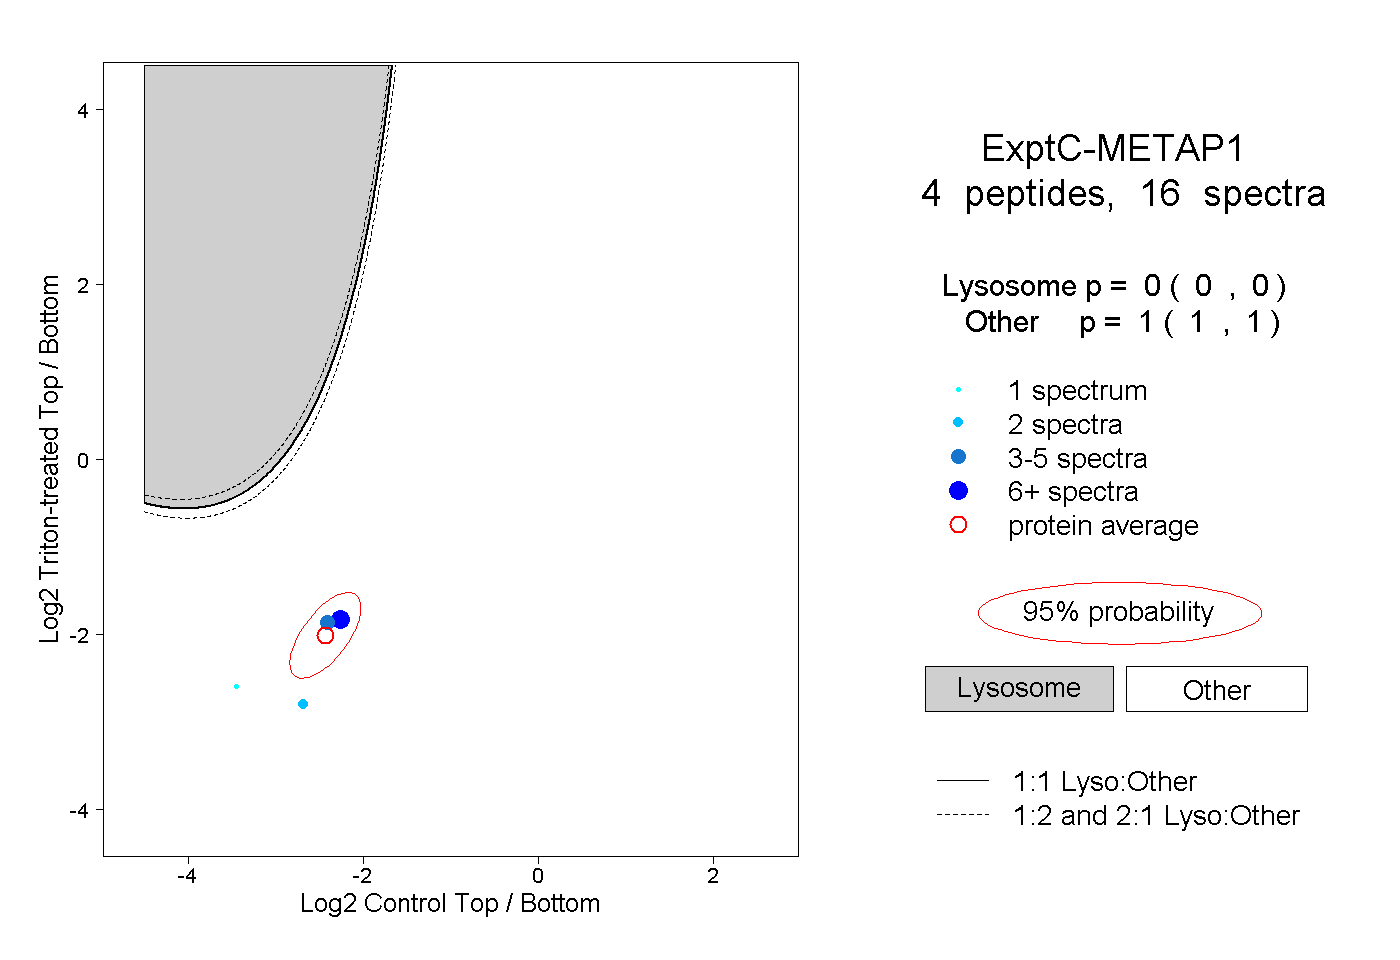 |
0.000 0.000 | 0.000 |
1.000 1.000 | 1.000 |
||||||||
| Plot | Lyso | Other | |||||||||||
| Expt D |
4 peptides |
5 spectra |
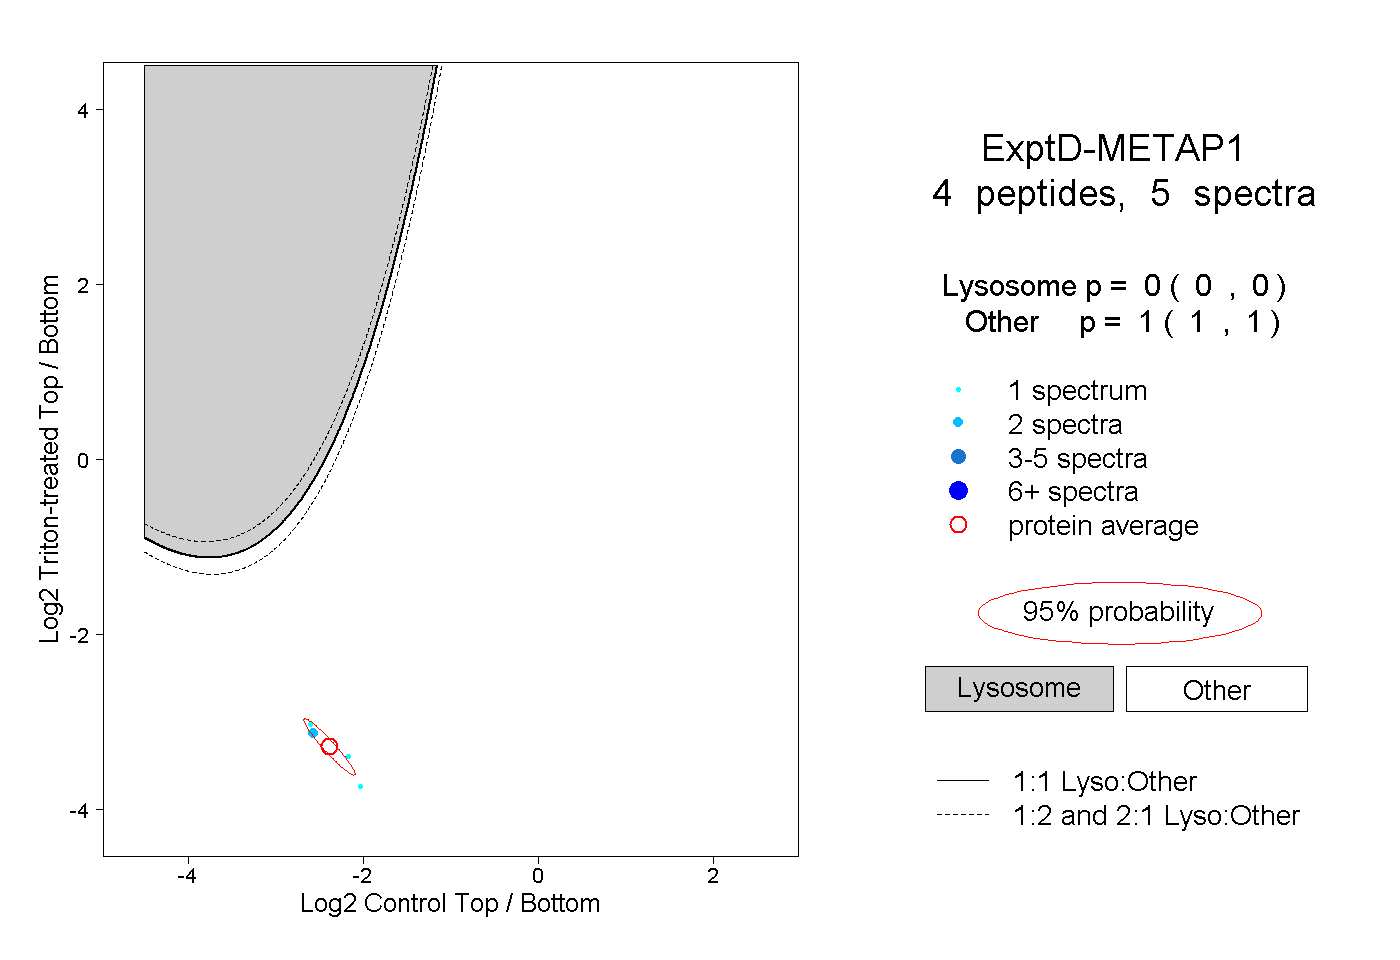 |
0.000 0.000 | 0.000 |
1.000 1.000 | 1.000 |