 5
5peptides
spectra
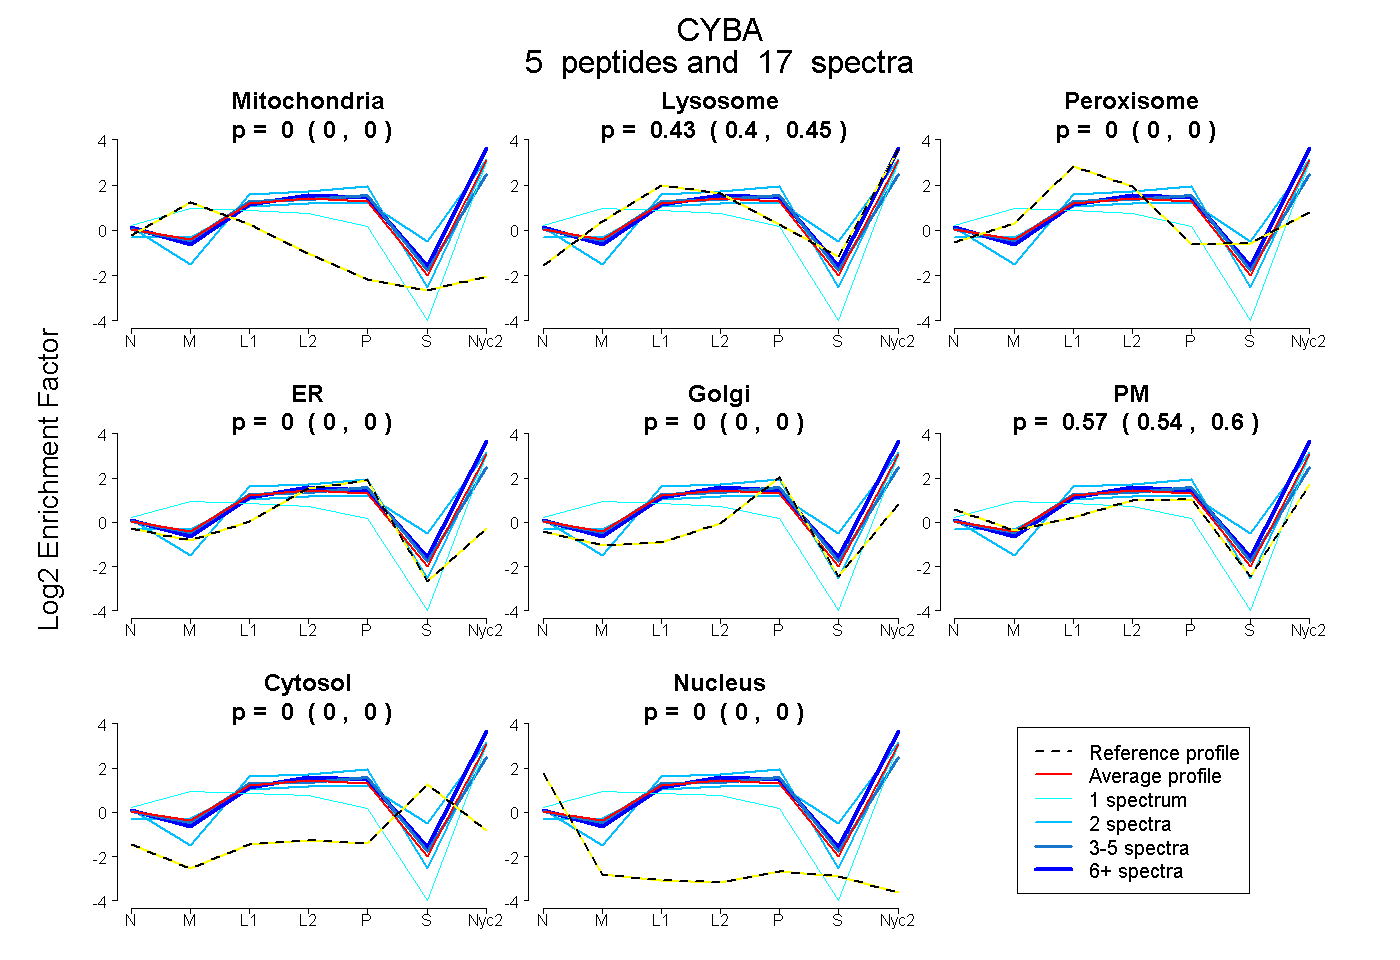
0.000 | 0.000
0.397 | 0.451
0.000 | 0.000
0.000 | 0.000
0.000 | 0.000
0.544 | 0.599
0.000 | 0.000
0.000 | 0.000
4peptides
spectra
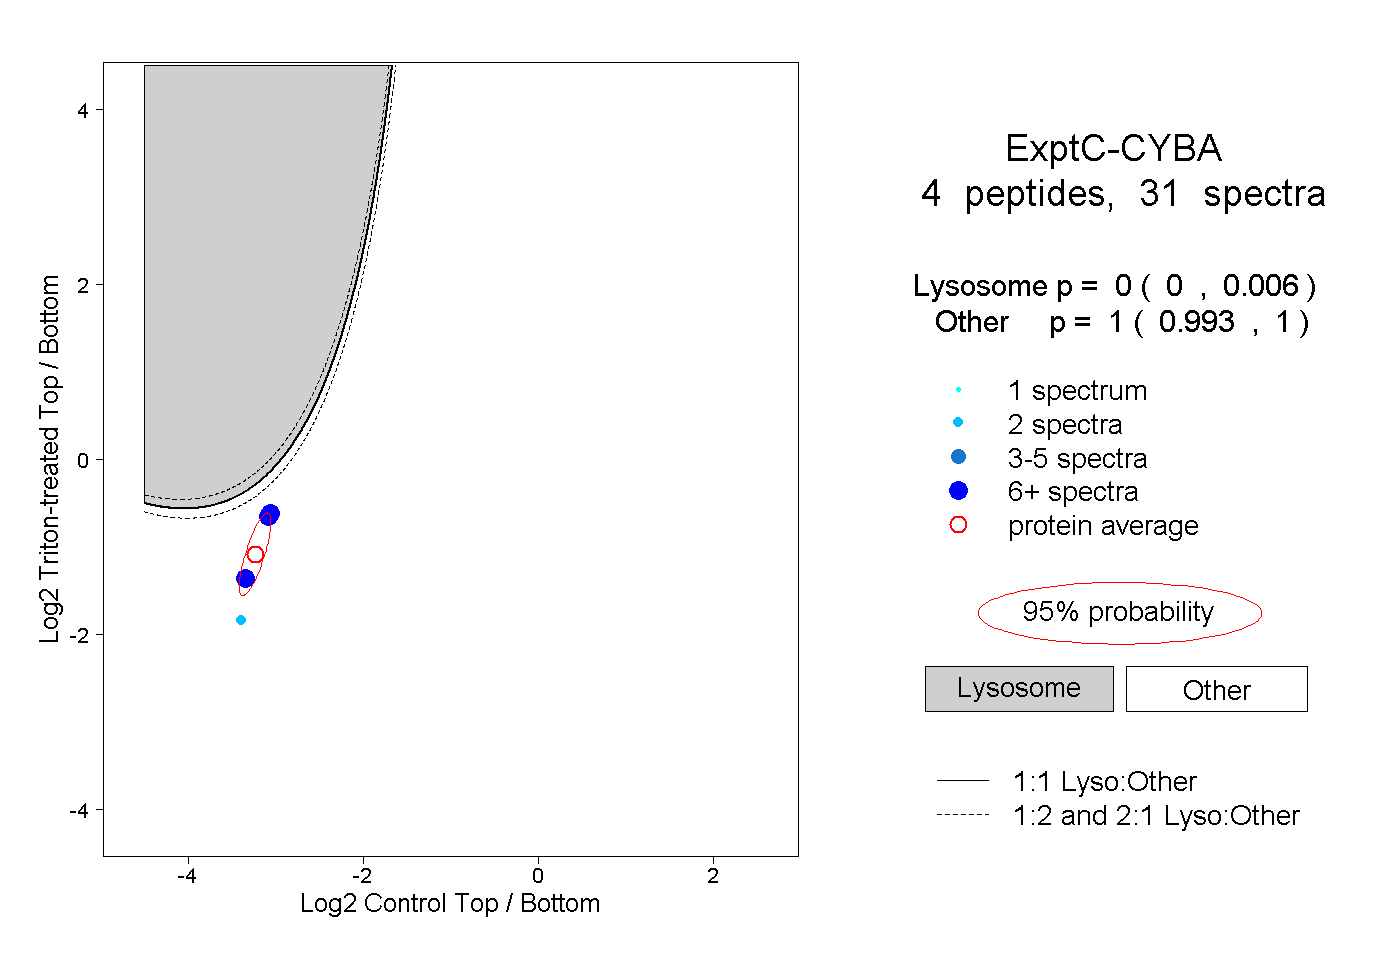
0.000 | 0.006
0.993 | 1.000
1peptide
spectrum
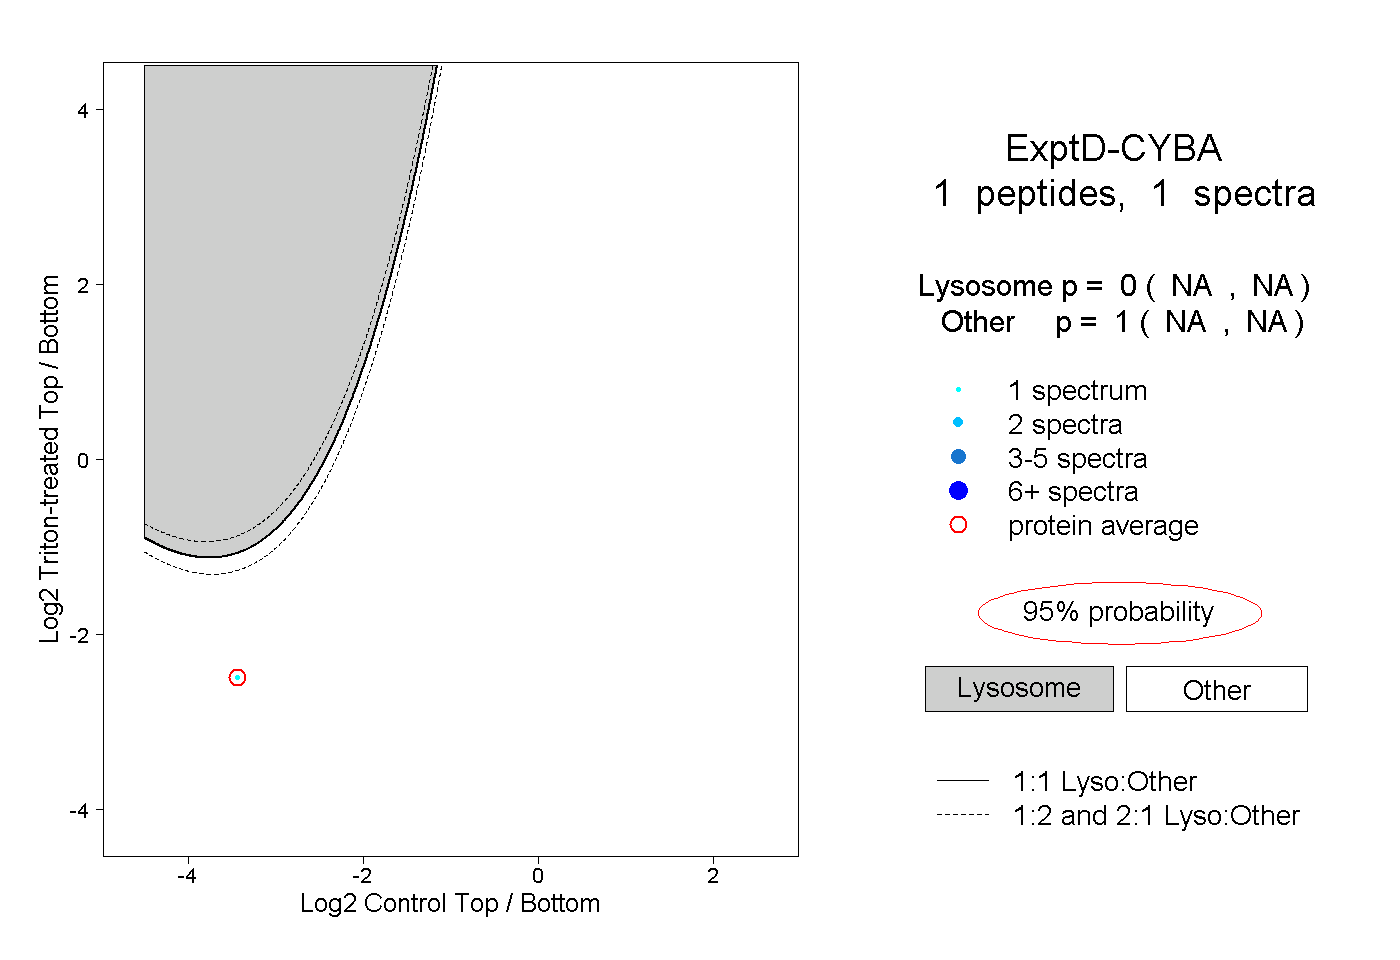
NA | NA
NA | NA