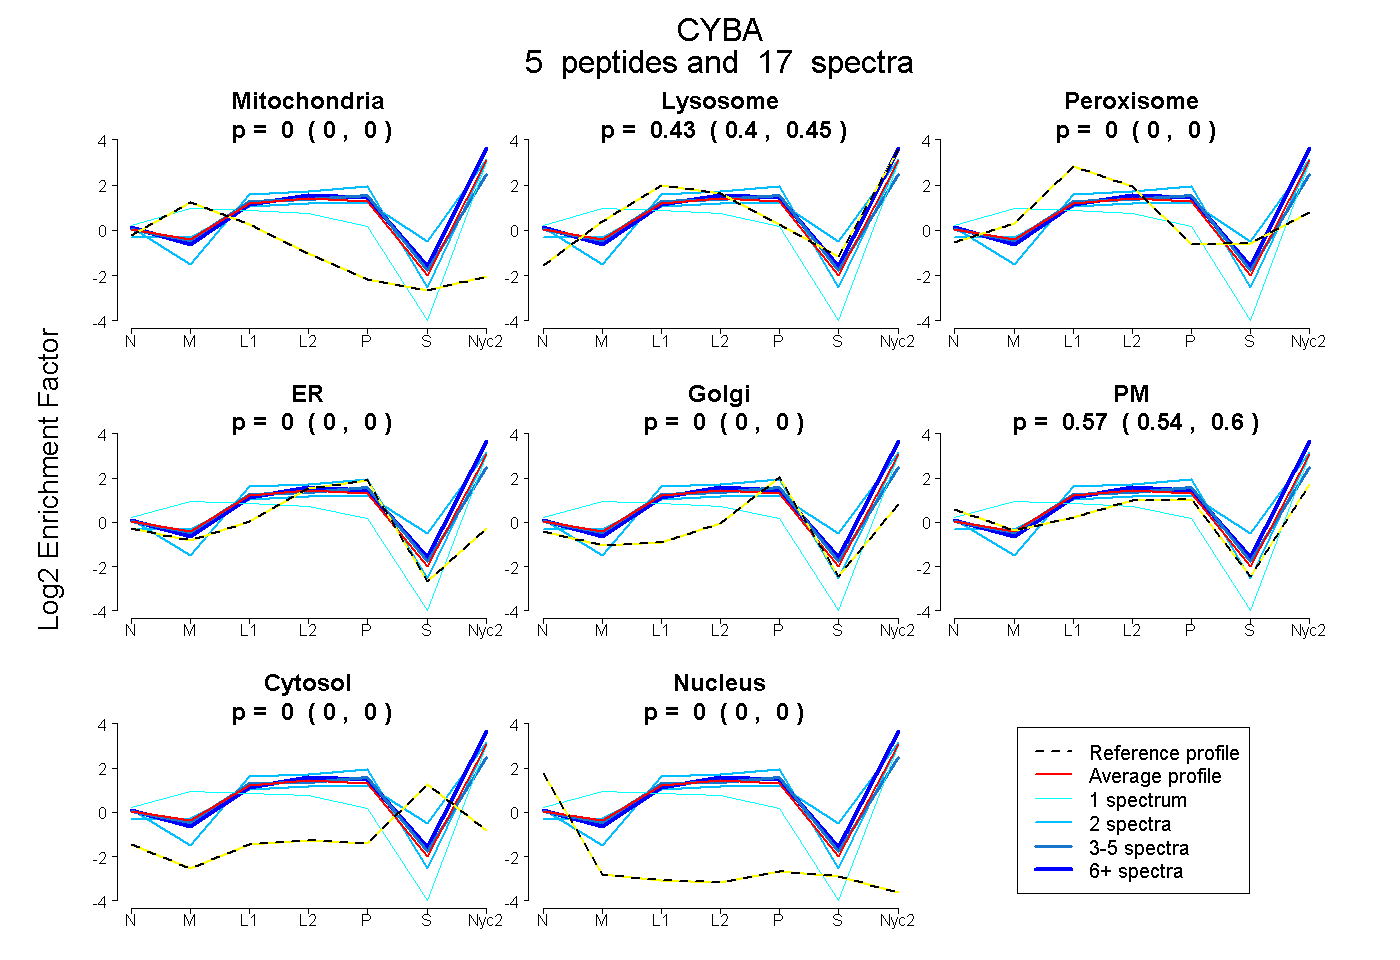
 5
5peptides
spectra
0.000 | 0.000
0.397 | 0.451
0.000 | 0.000
0.000 | 0.000
0.000 | 0.000
0.544 | 0.599
0.000 | 0.000
0.000 | 0.000
| Plot | Mito | Lyso | Perox | ER | Golgi | PM | Cytosol | Nucleus | |||||
| Expt A |
5 peptides |
17 spectra |
|
0.000 0.000 | 0.000 |
0.427 0.397 | 0.451 |
0.000 0.000 | 0.000 |
0.000 0.000 | 0.000 |
0.000 0.000 | 0.000 |
0.573 0.544 | 0.599 |
0.000 0.000 | 0.000 |
0.000 0.000 | 0.000 |
| 1 spectrum, YLTAVVK | 0.067 | 0.284 | 0.000 | 0.000 | 0.000 | 0.649 | 0.000 | 0.000 | ||
| 2 spectra, GSTMER | 0.000 | 0.620 | 0.000 | 0.000 | 0.068 | 0.254 | 0.057 | 0.000 | ||
| 2 spectra, ERPQVGGTIK | 0.000 | 0.338 | 0.000 | 0.031 | 0.000 | 0.631 | 0.000 | 0.000 | ||
| 7 spectra, LFGPLTR | 0.000 | 0.500 | 0.000 | 0.000 | 0.000 | 0.500 | 0.000 | 0.000 | ||
| 5 spectra, QPPTNPPPRPPAEVR | 0.000 | 0.375 | 0.000 | 0.079 | 0.000 | 0.546 | 0.000 | 0.000 |
| Plot | Lyso | Other | |||||||||||
| Expt C |
4 peptides |
31 spectra |
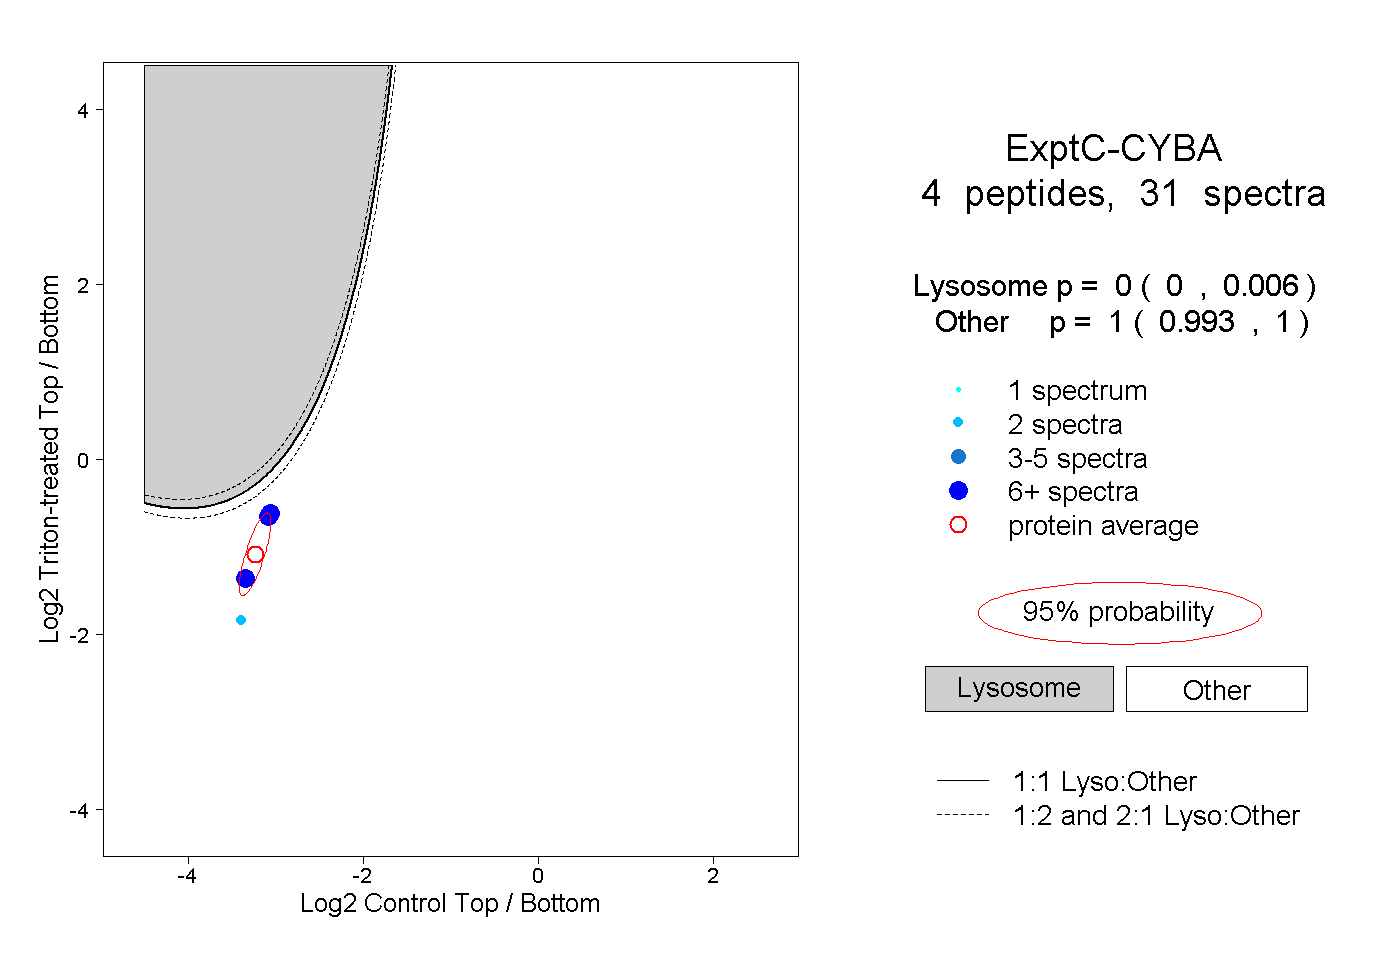 |
0.000 0.000 | 0.006 |
1.000 0.993 | 1.000 |
||||||||
| Plot | Lyso | Other | |||||||||||
| Expt D |
1 peptide |
1 spectrum |
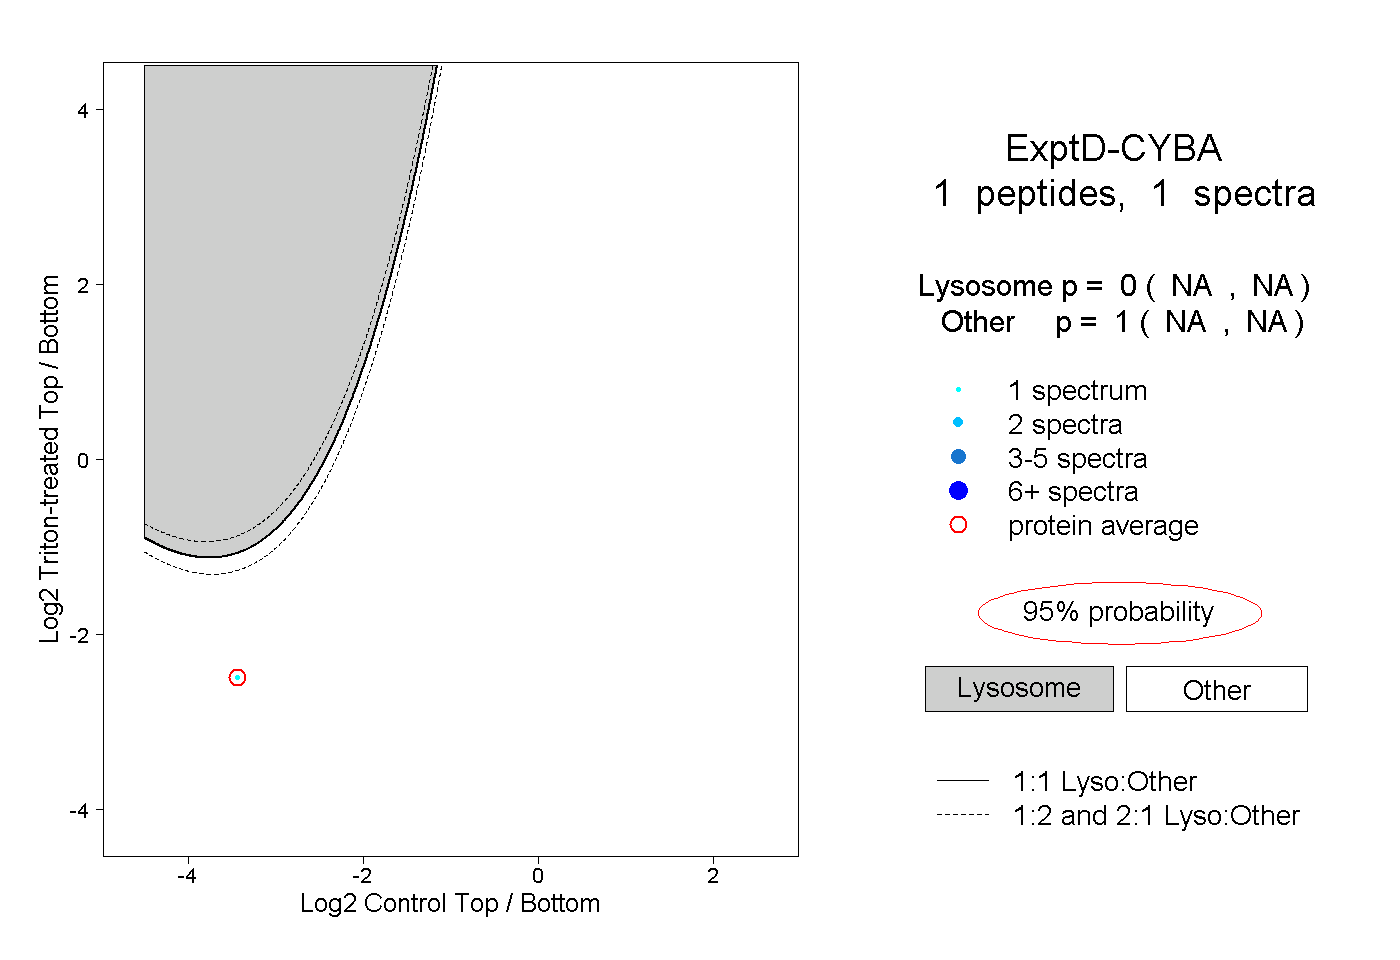 |
0.000 NA | NA |
1.000 NA | NA |