 8
8peptides
spectra
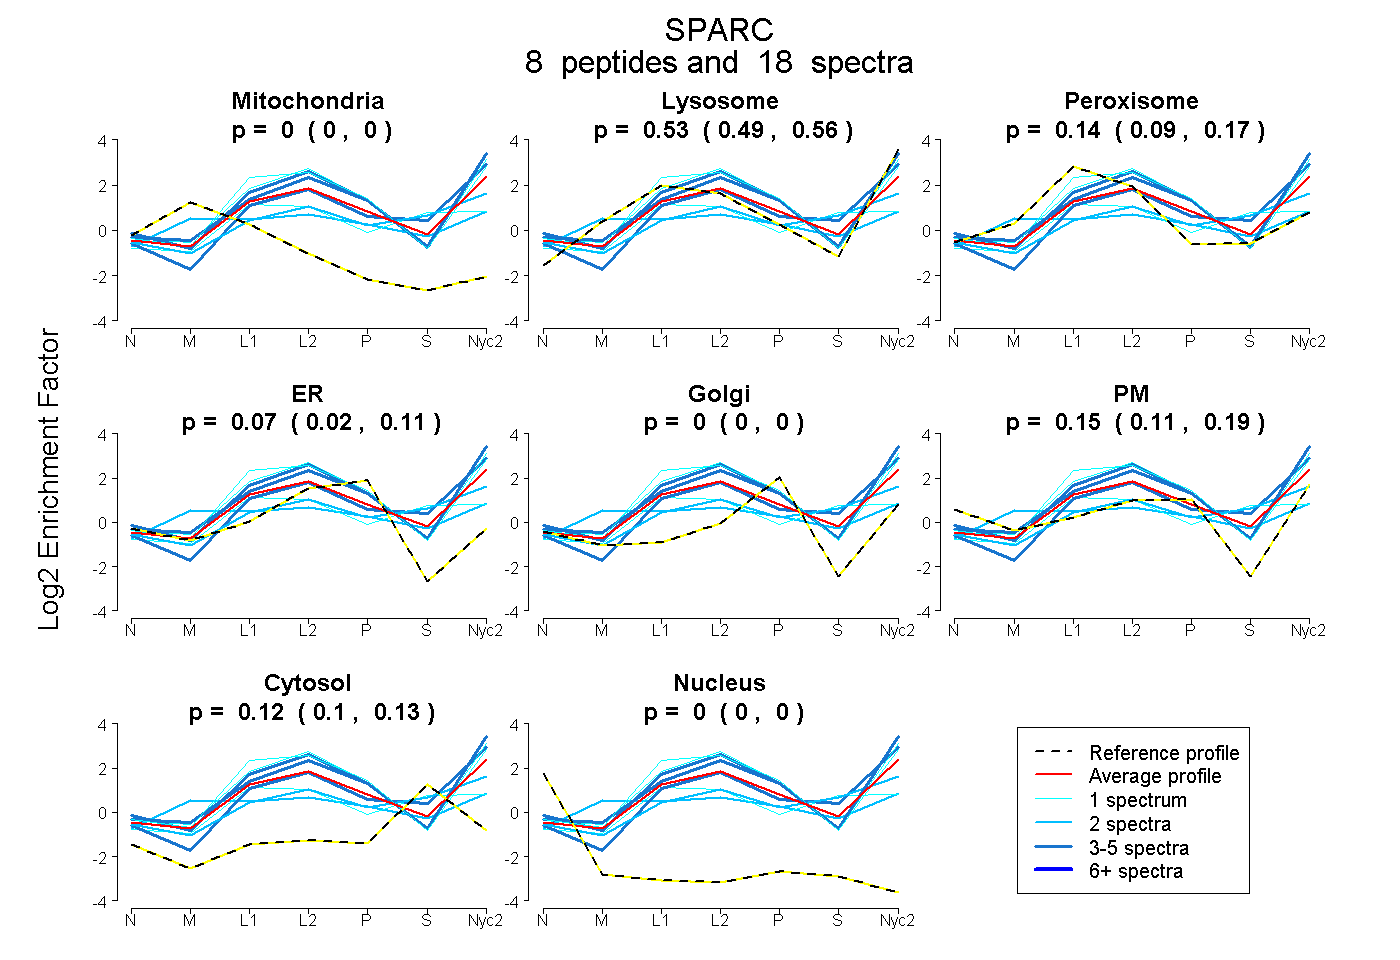
0.000 | 0.000
0.486 | 0.564
0.090 | 0.175
0.019 | 0.108
0.000 | 0.000
0.107 | 0.192
0.097 | 0.130
0.000 | 0.000
7peptides
spectra
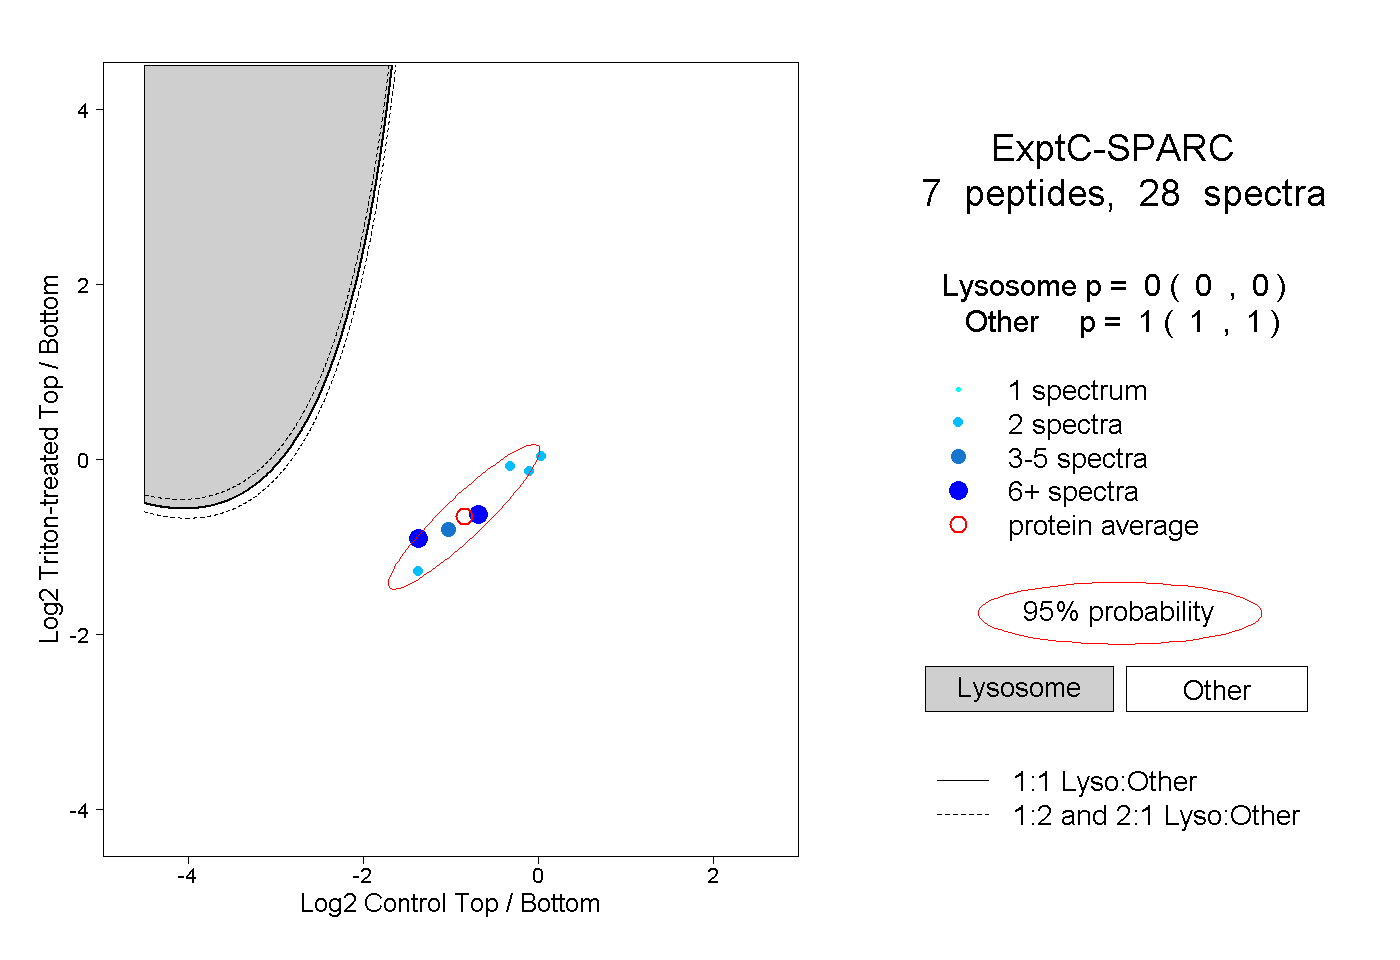
0.000 | 0.000
1.000 | 1.000
1peptide
spectra
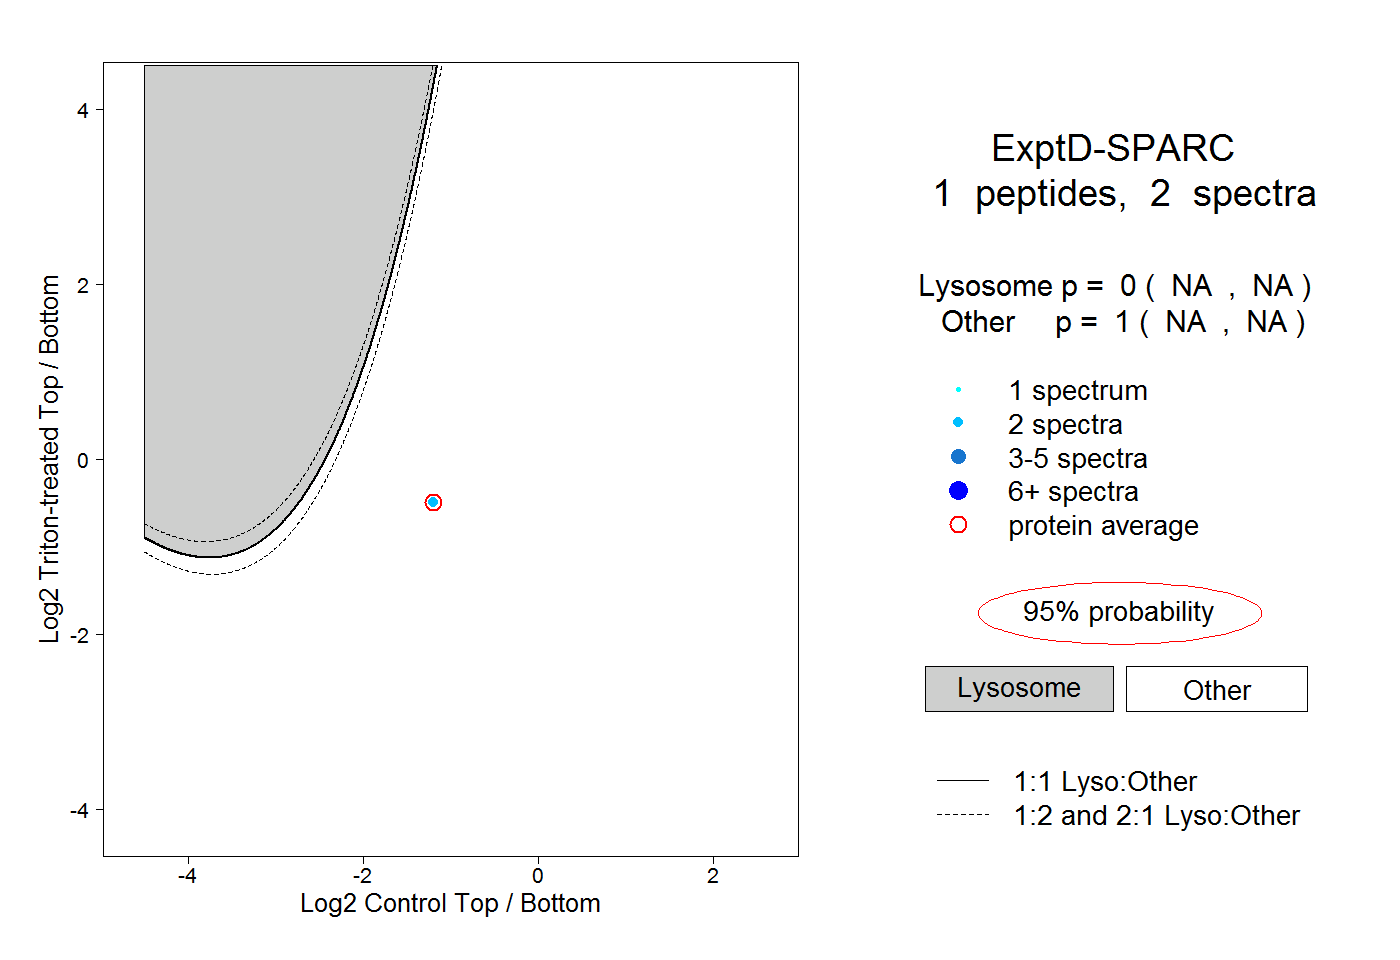
NA | NA
NA | NA