 8
8peptides
spectra
0.000 | 0.000
0.486 | 0.564
0.090 | 0.175
0.019 | 0.108
0.000 | 0.000
0.107 | 0.192
0.097 | 0.130
0.000 | 0.000
| Plot | Mito | Lyso | Perox | ER | Golgi | PM | Cytosol | Nucleus | |||||
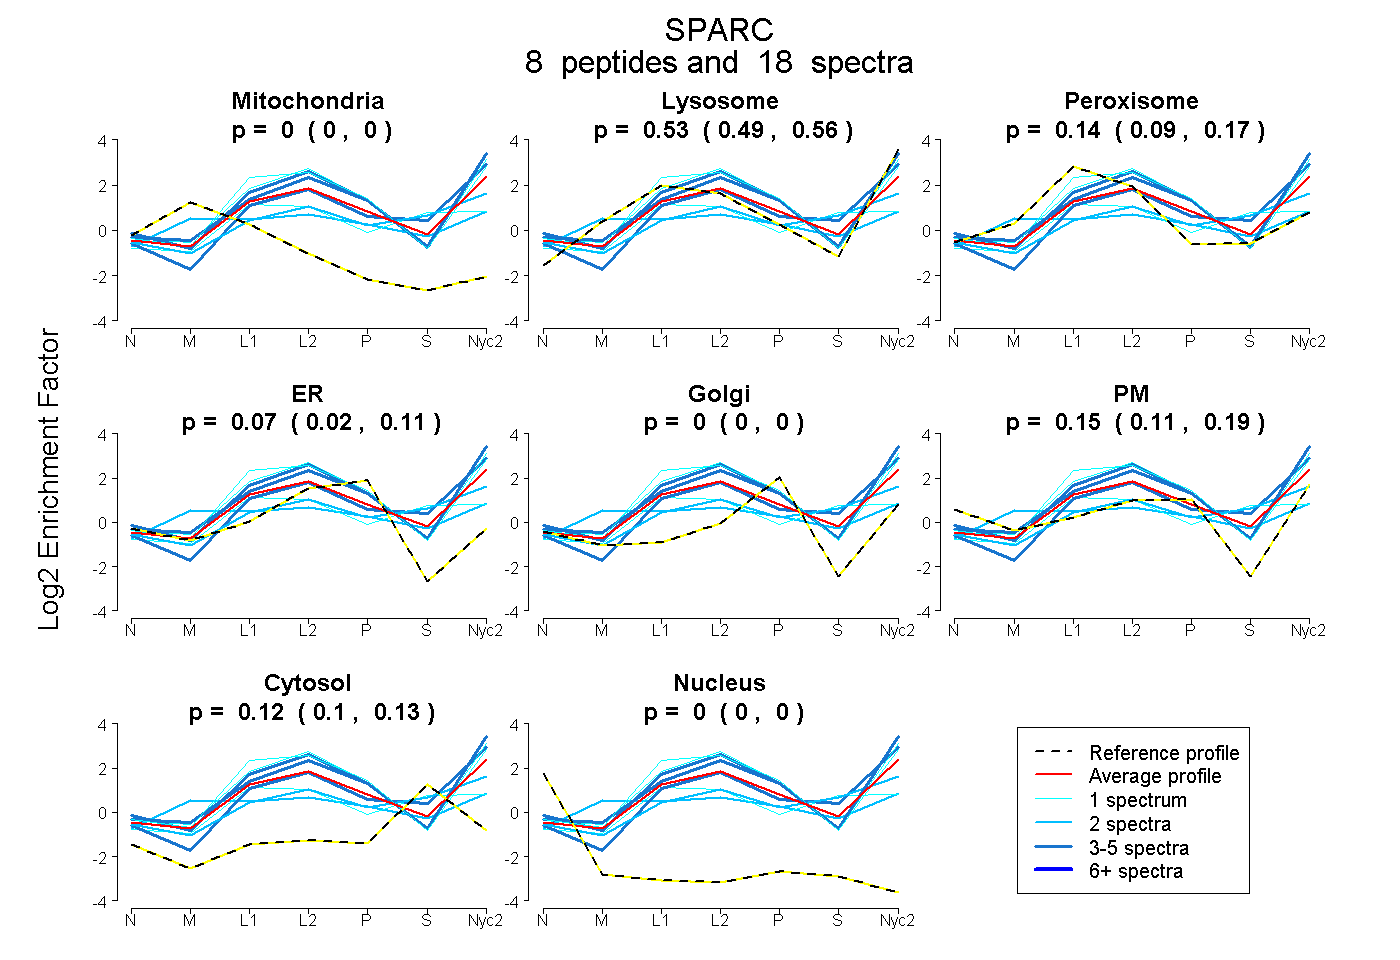
| Expt A |
8 peptides |
18 spectra |
|
0.000 0.000 | 0.000 |
0.528 0.486 | 0.564 |
0.137 0.090 | 0.175 |
0.067 0.019 | 0.108 |
0.000 0.000 | 0.000 |
0.153 0.107 | 0.192 |
0.116 0.097 | 0.130 |
0.000 0.000 | 0.000 |
| 1 spectrum, FFETCDLDNDK | 0.000 | 0.728 | 0.043 | 0.150 | 0.000 | 0.079 | 0.000 | 0.000 | ||
| 2 spectra, LHLDYIGPCK | 0.000 | 0.391 | 0.115 | 0.000 | 0.000 | 0.121 | 0.374 | 0.000 | ||
| 1 spectrum, YIAPCLDSELTEFPLR | 0.000 | 0.663 | 0.143 | 0.194 | 0.000 | 0.000 | 0.000 | 0.000 | ||
| 3 spectra, DEGNNLLTEK | 0.000 | 0.684 | 0.000 | 0.000 | 0.000 | 0.070 | 0.246 | 0.000 | ||
| 2 spectra, APLIPMEHCTTR | 0.091 | 0.244 | 0.288 | 0.000 | 0.205 | 0.000 | 0.172 | 0.000 | ||
| 1 spectrum, CTLEGTK | 0.000 | 0.185 | 0.450 | 0.001 | 0.000 | 0.000 | 0.364 | 0.000 | ||
| 4 spectra, LEAGDHPVELLAR | 0.000 | 0.708 | 0.000 | 0.022 | 0.000 | 0.271 | 0.000 | 0.000 | ||
| 4 spectra, NVLVTLYER | 0.000 | 0.698 | 0.000 | 0.000 | 0.000 | 0.302 | 0.000 | 0.000 |
| Plot | Lyso | Other | |||||||||||
| Expt C |
7 peptides |
28 spectra |
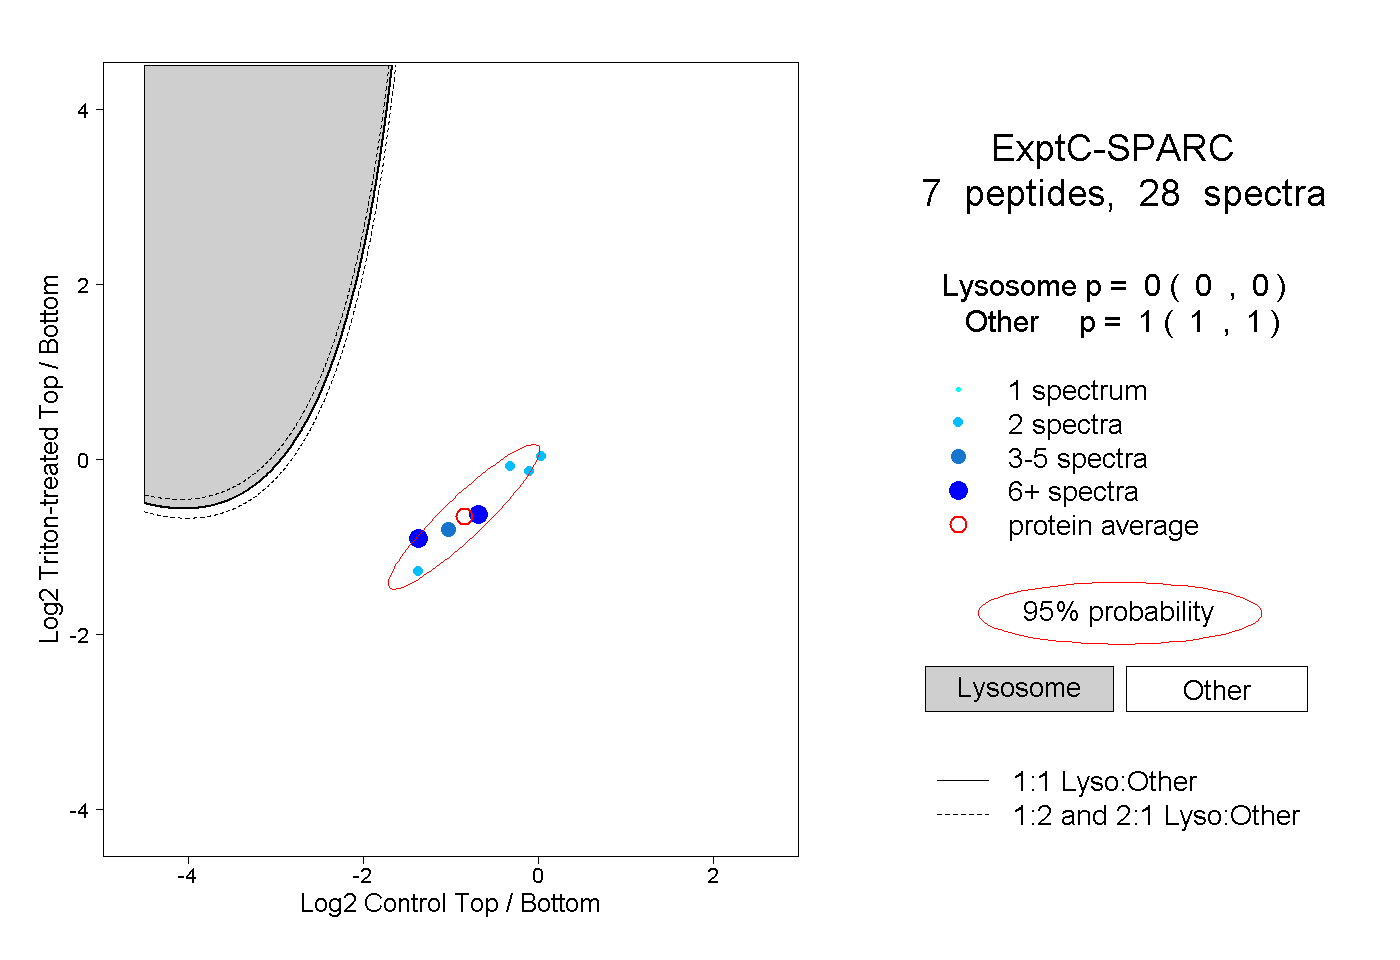 |
0.000 0.000 | 0.000 |
1.000 1.000 | 1.000 |
||||||||
| Plot | Lyso | Other | |||||||||||
| Expt D |
1 peptide |
2 spectra |
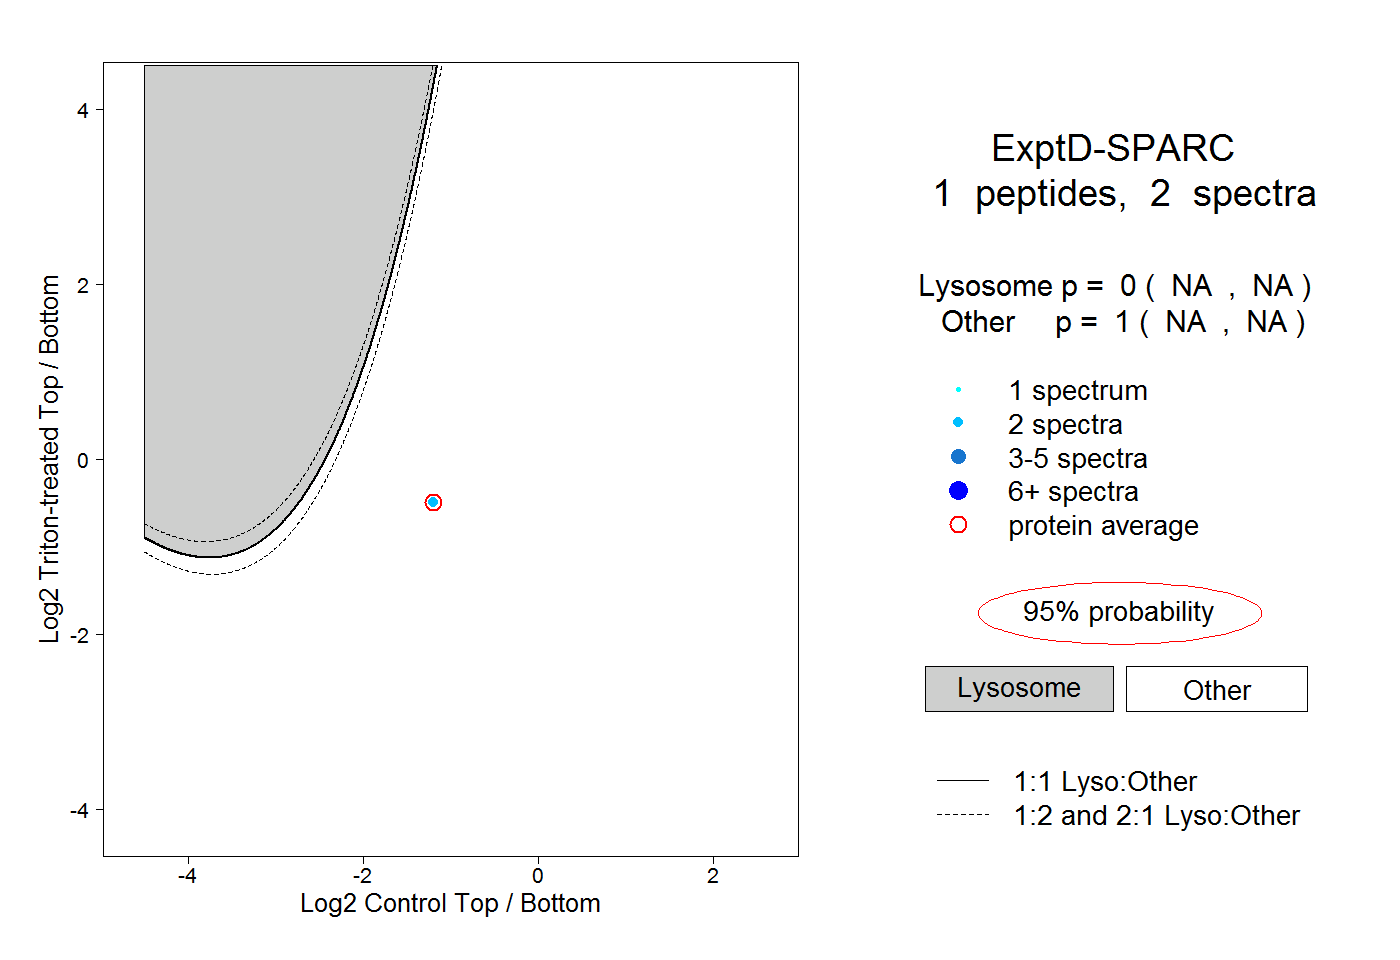 |
0.000 NA | NA |
1.000 NA | NA |