 7
7peptides
spectra
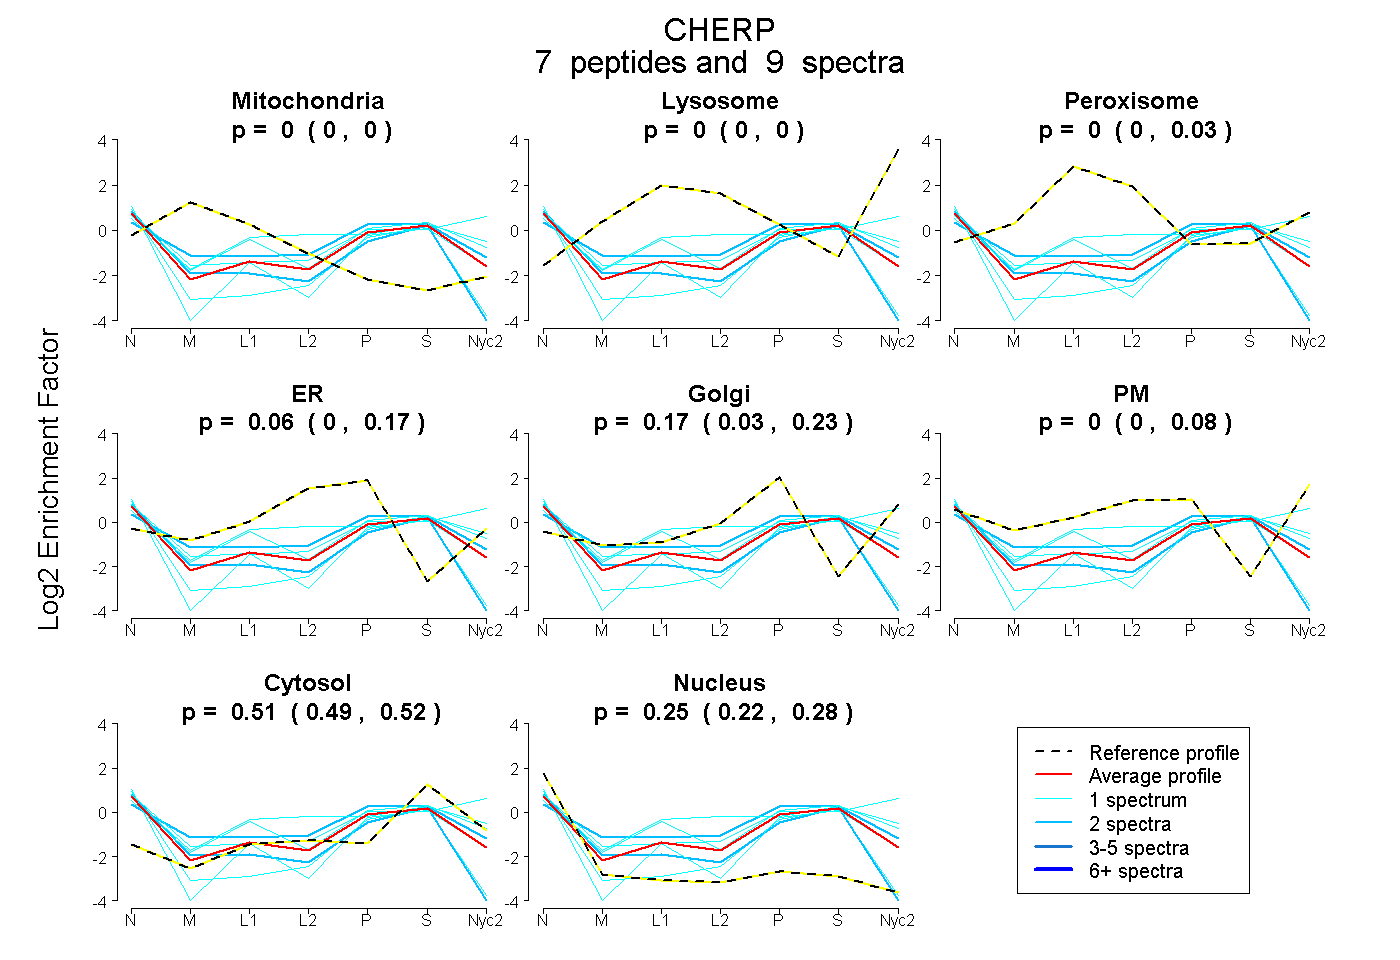
0.000 | 0.000
0.000 | 0.000
0.000 | 0.025
0.000 | 0.167
0.029 | 0.228
0.000 | 0.081
0.487 | 0.523
0.225 | 0.283
1peptide
spectrum
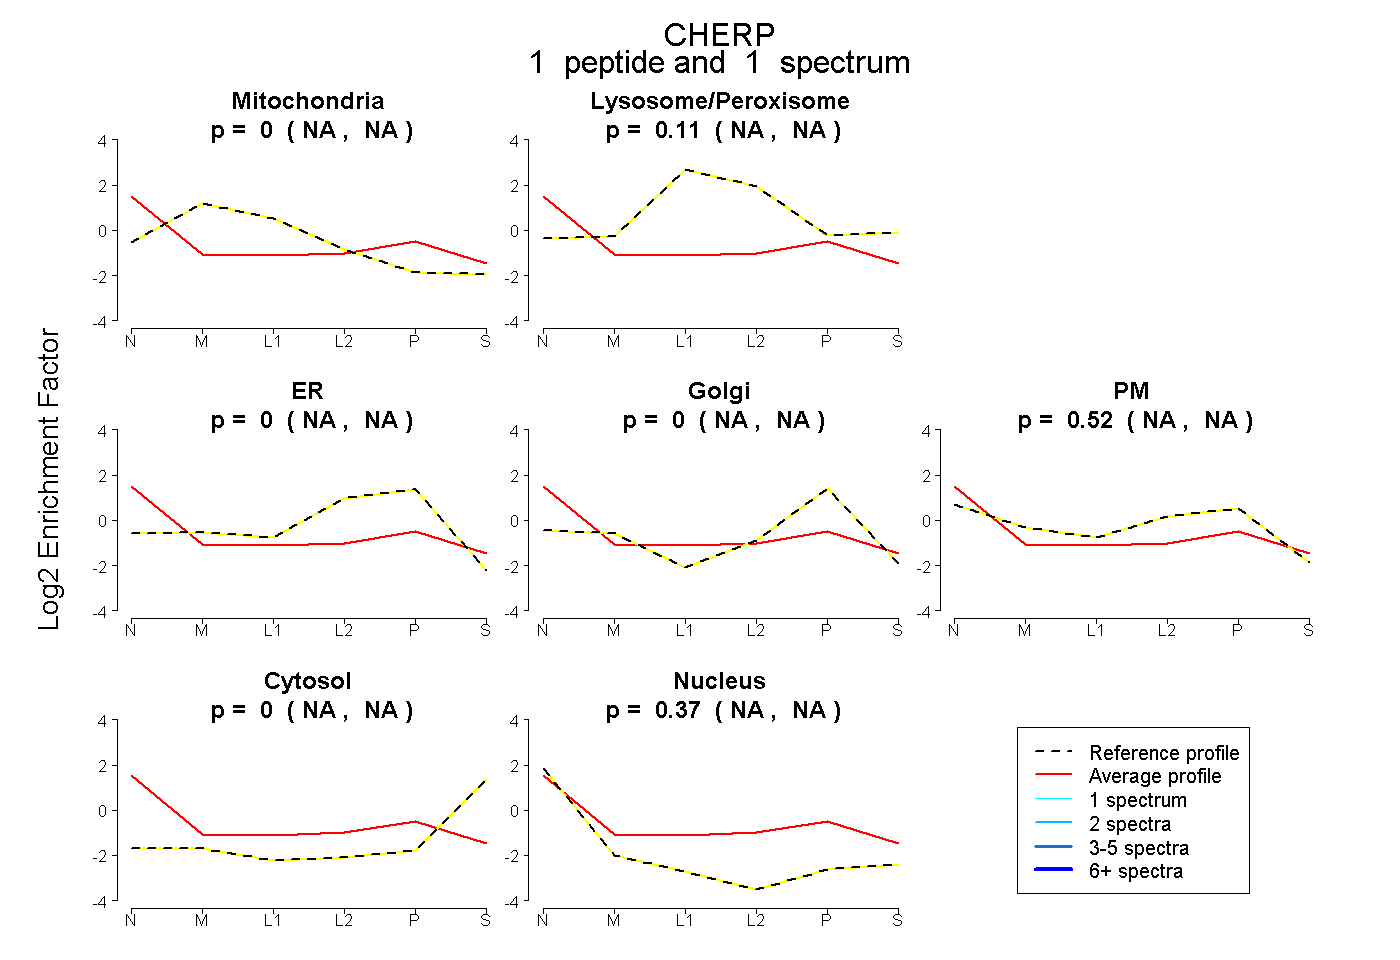
NA | NA
NA | NA
NA | NA
NA | NA
NA | NA
NA | NA
NA | NA
4peptides
spectra
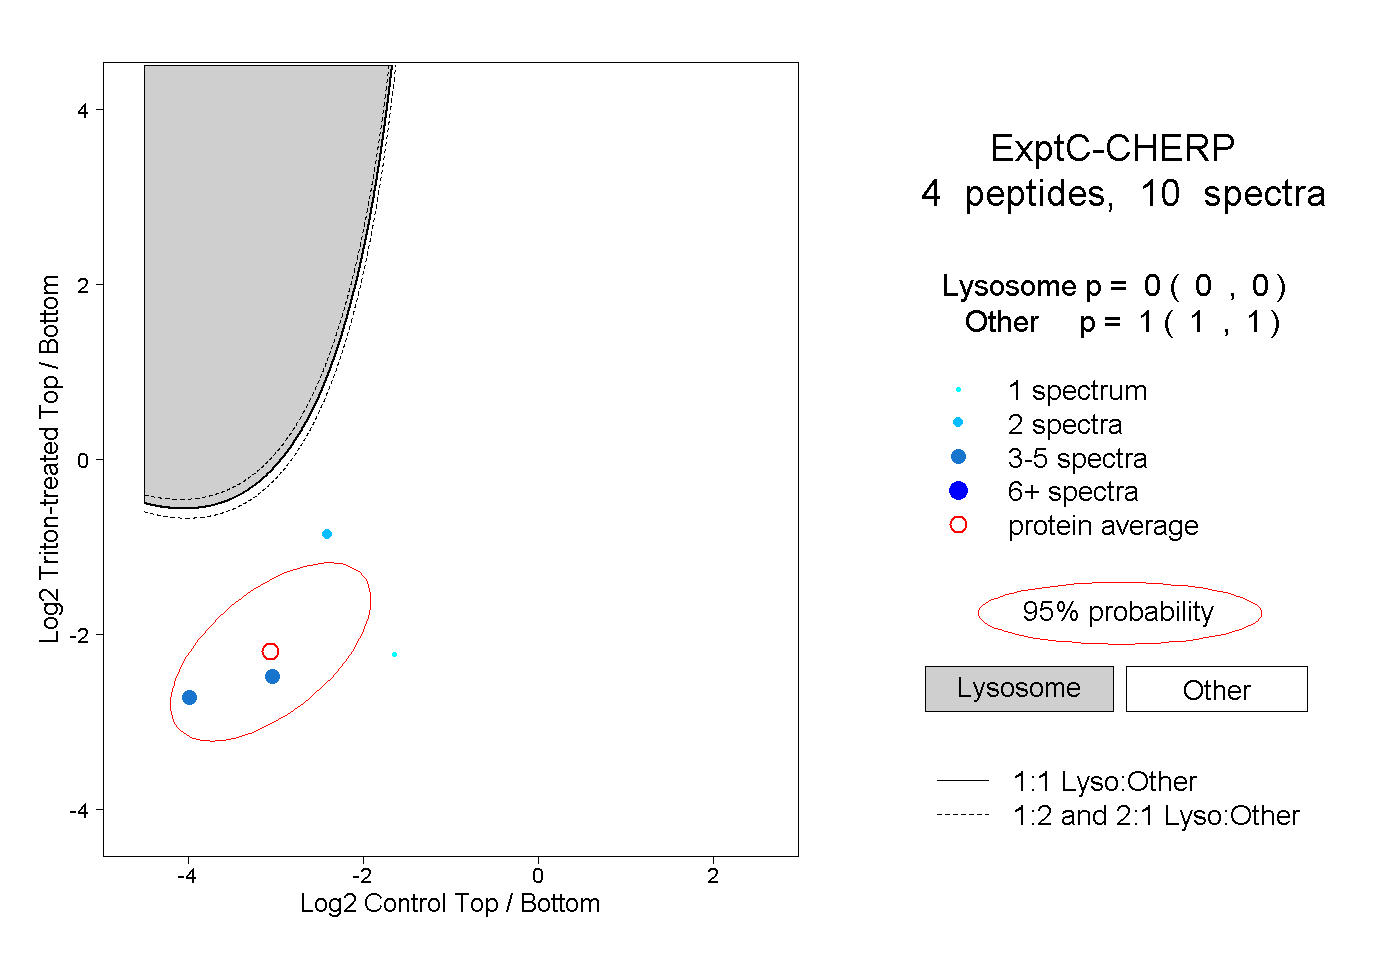
0.000 | 0.000
1.000 | 1.000
1peptide
spectrum
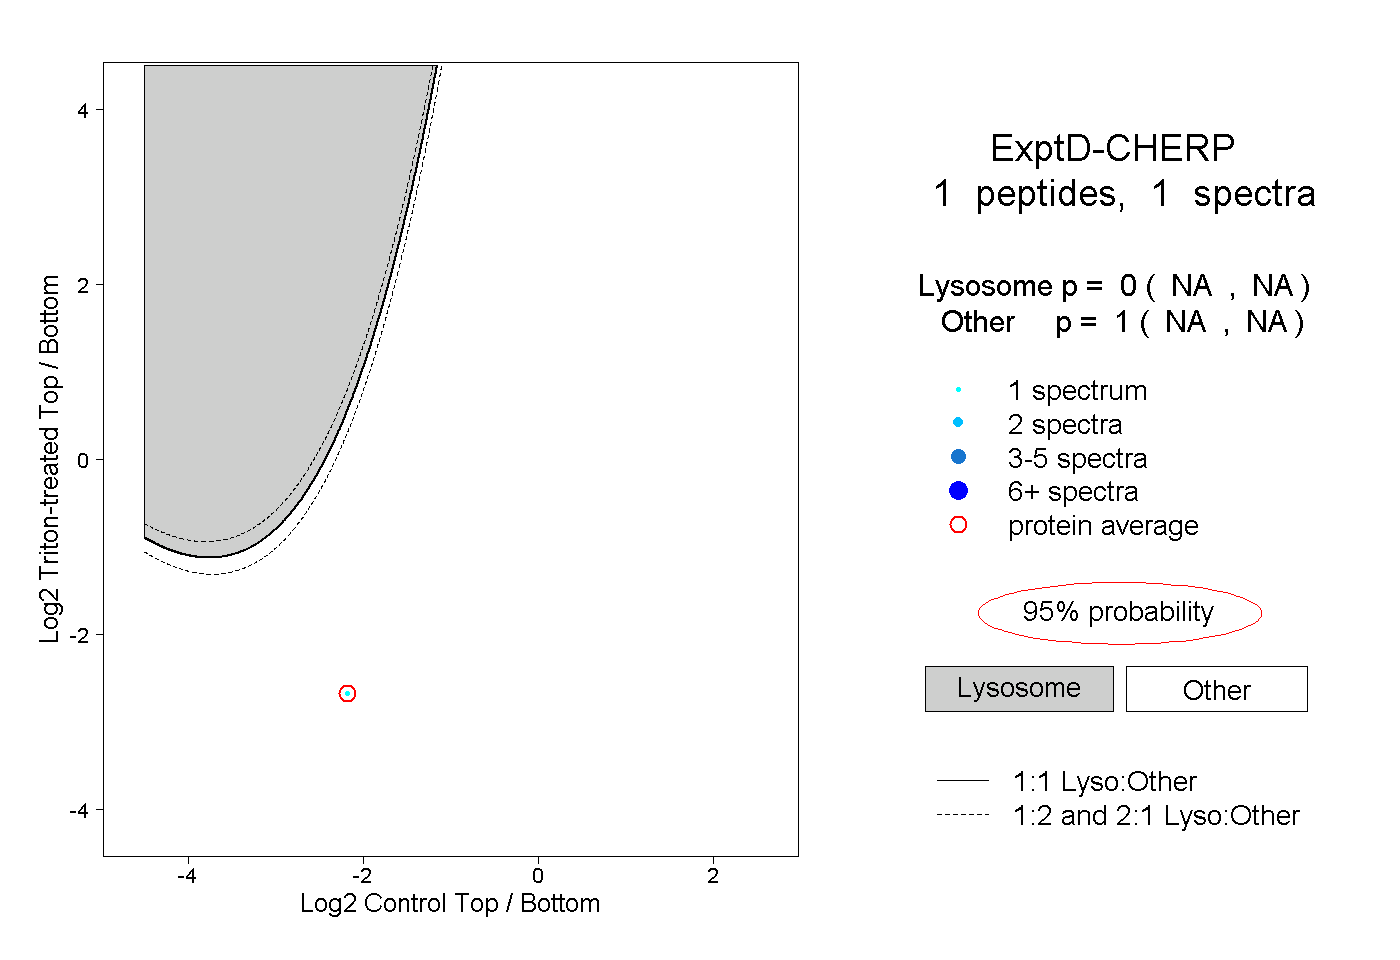
NA | NA
NA | NA