 7
7peptides
spectra
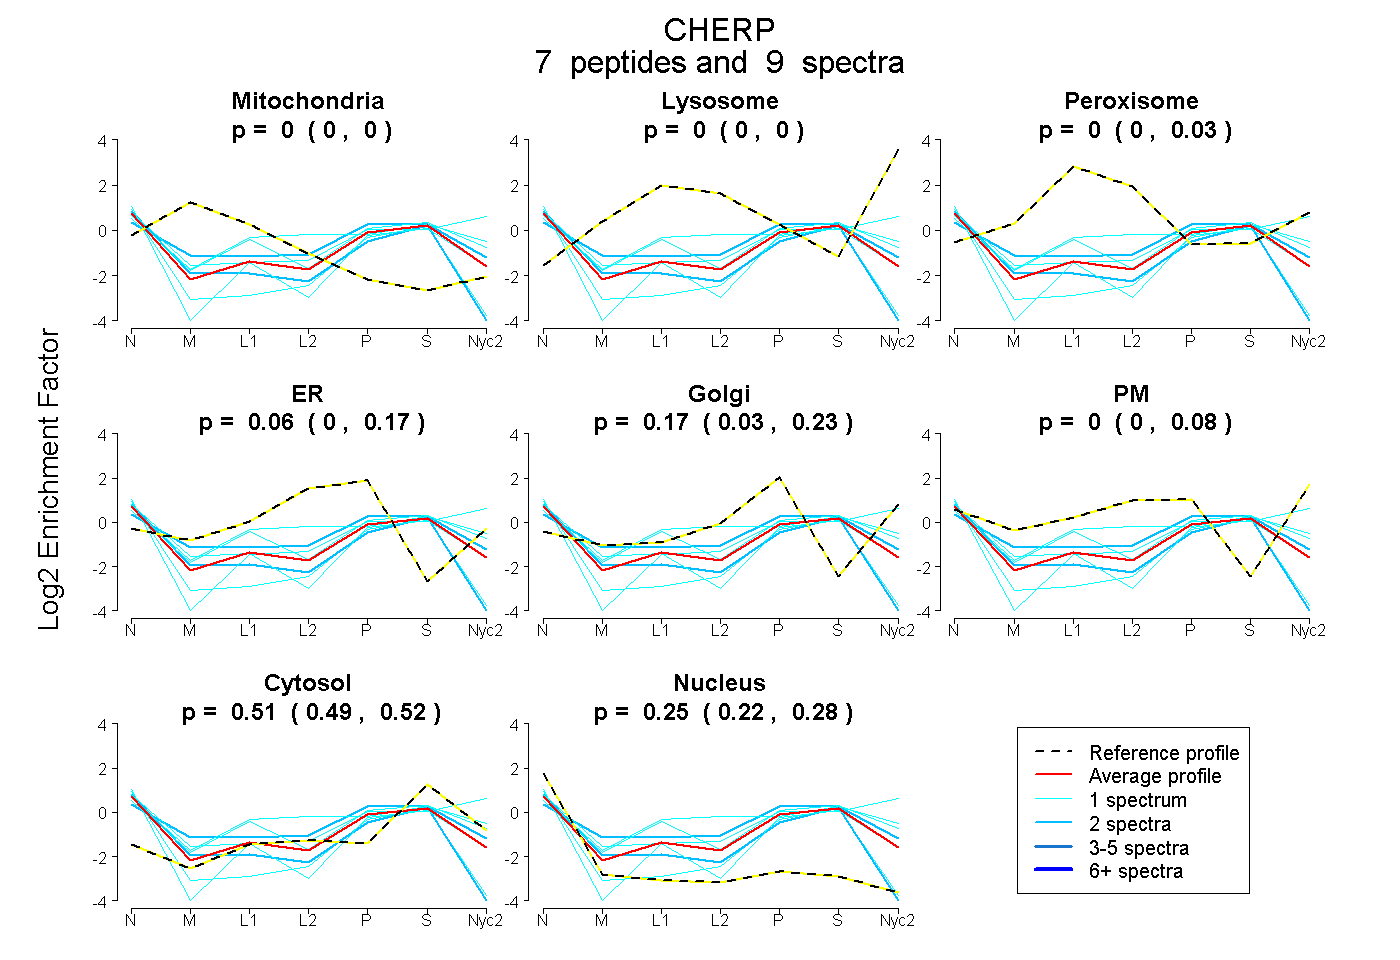
0.000 | 0.000
0.000 | 0.000
0.000 | 0.025
0.000 | 0.167
0.029 | 0.228
0.000 | 0.081
0.487 | 0.523
0.225 | 0.283
| Plot | Mito | Lyso | Perox | ER | Golgi | PM | Cytosol | Nucleus | |||||
| Expt A |
7 peptides |
9 spectra |
|
0.000 0.000 | 0.000 |
0.000 0.000 | 0.000 |
0.000 0.000 | 0.025 |
0.060 0.000 | 0.167 |
0.170 0.029 | 0.228 |
0.003 0.000 | 0.081 |
0.512 0.487 | 0.523 |
0.255 0.225 | 0.283 |
| 1 spectrum, LALEQQQLICK | 0.014 | 0.000 | 0.000 | 0.000 | 0.200 | 0.000 | 0.462 | 0.325 | ||
| 2 spectra, DAISAGK | 0.042 | 0.000 | 0.033 | 0.126 | 0.195 | 0.000 | 0.489 | 0.115 | ||
| 1 spectrum, LLQLWEK | 0.000 | 0.000 | 0.000 | 0.000 | 0.162 | 0.169 | 0.532 | 0.137 | ||
| 1 spectrum, NGPEFEK | 0.000 | 0.000 | 0.110 | 0.000 | 0.183 | 0.062 | 0.496 | 0.149 | ||
| 1 spectrum, ELLAALQK | 0.000 | 0.000 | 0.000 | 0.000 | 0.000 | 0.000 | 0.454 | 0.546 | ||
| 2 spectra, ITADGAHFELR | 0.000 | 0.000 | 0.000 | 0.061 | 0.000 | 0.000 | 0.445 | 0.494 | ||
| 1 spectrum, NWMFSNAK | 0.000 | 0.000 | 0.163 | 0.034 | 0.000 | 0.244 | 0.456 | 0.103 |
| Plot | Mito | Lyso or Perox | ER | Golgi | PM | Cytosol | Nucleus | ||||||
| Expt B |
1 peptide |
1 spectrum |
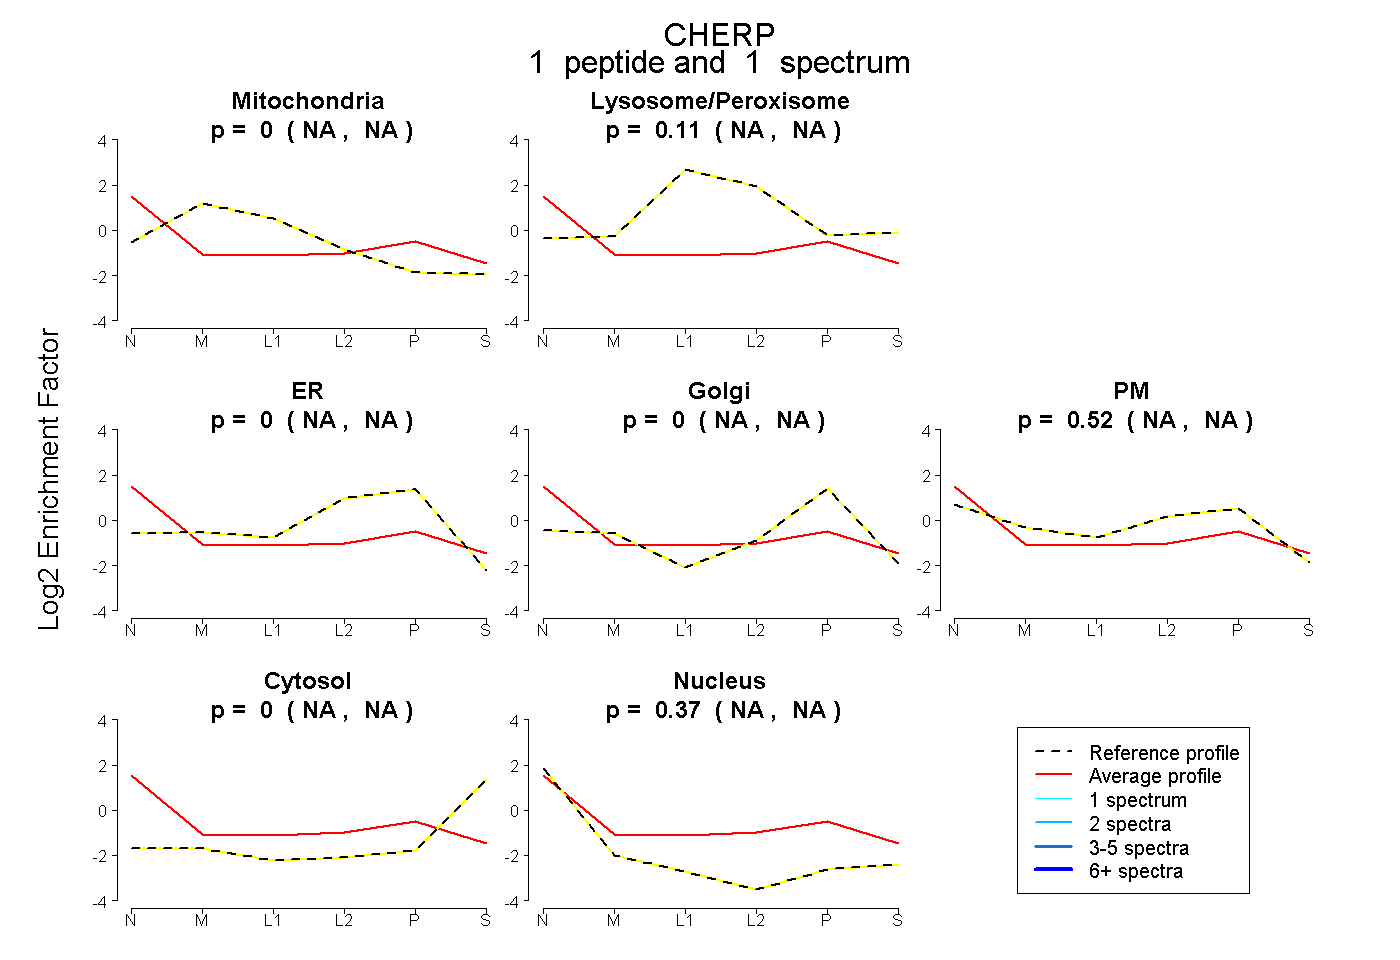 |
0.000 NA | NA |
0.107 NA | NA |
0.000 NA | NA |
0.000 NA | NA |
0.524 NA | NA |
0.000 NA | NA |
0.369 NA | NA |
|||
| Plot | Lyso | Other | |||||||||||
| Expt C |
4 peptides |
10 spectra |
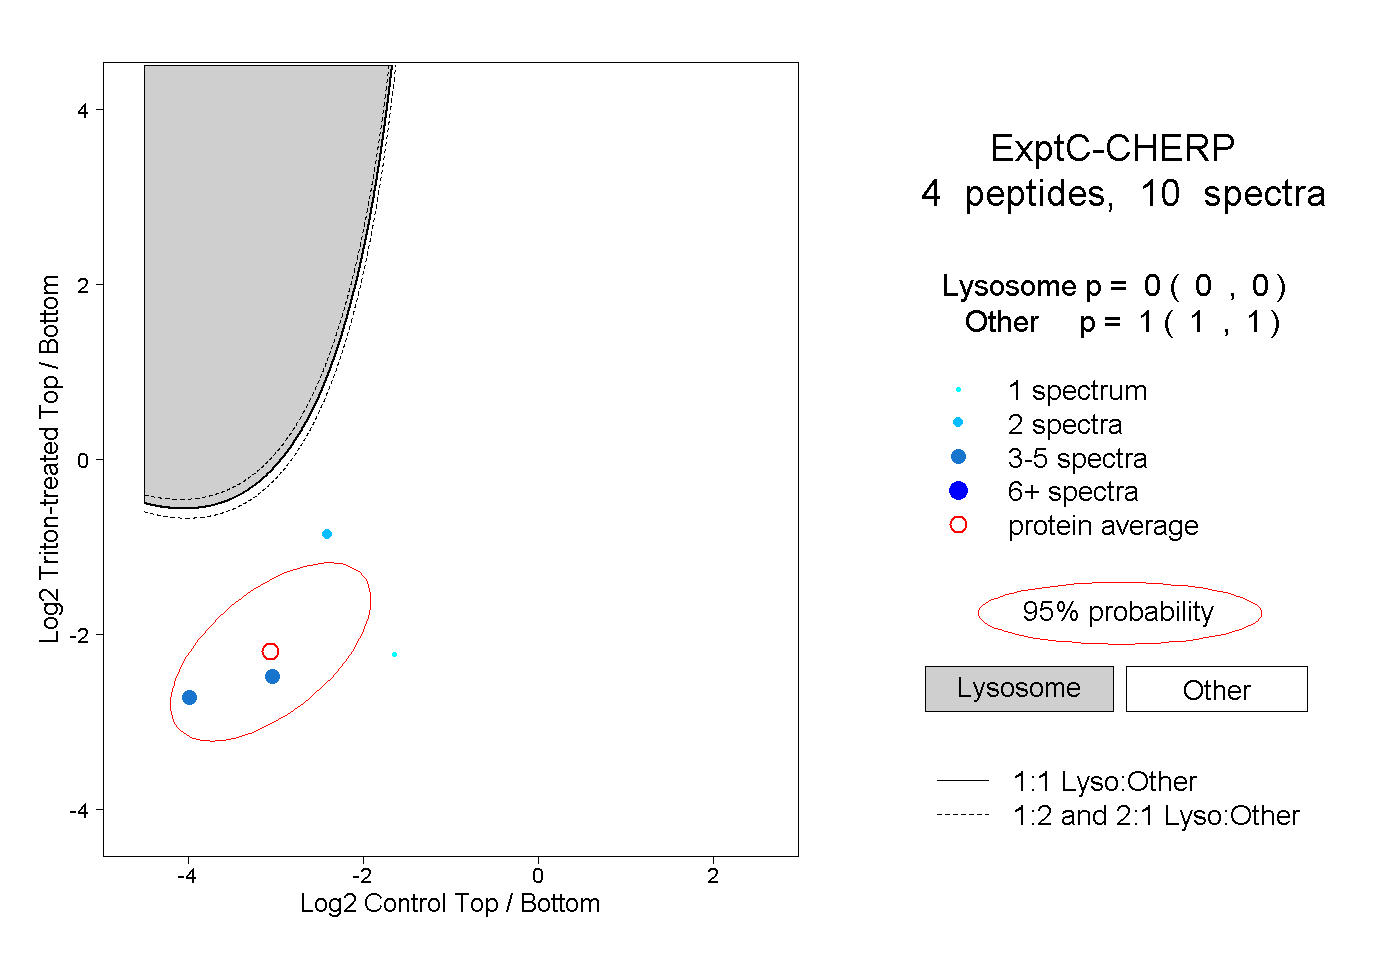 |
0.000 0.000 | 0.000 |
1.000 1.000 | 1.000 |
||||||||
| Plot | Lyso | Other | |||||||||||
| Expt D |
1 peptide |
1 spectrum |
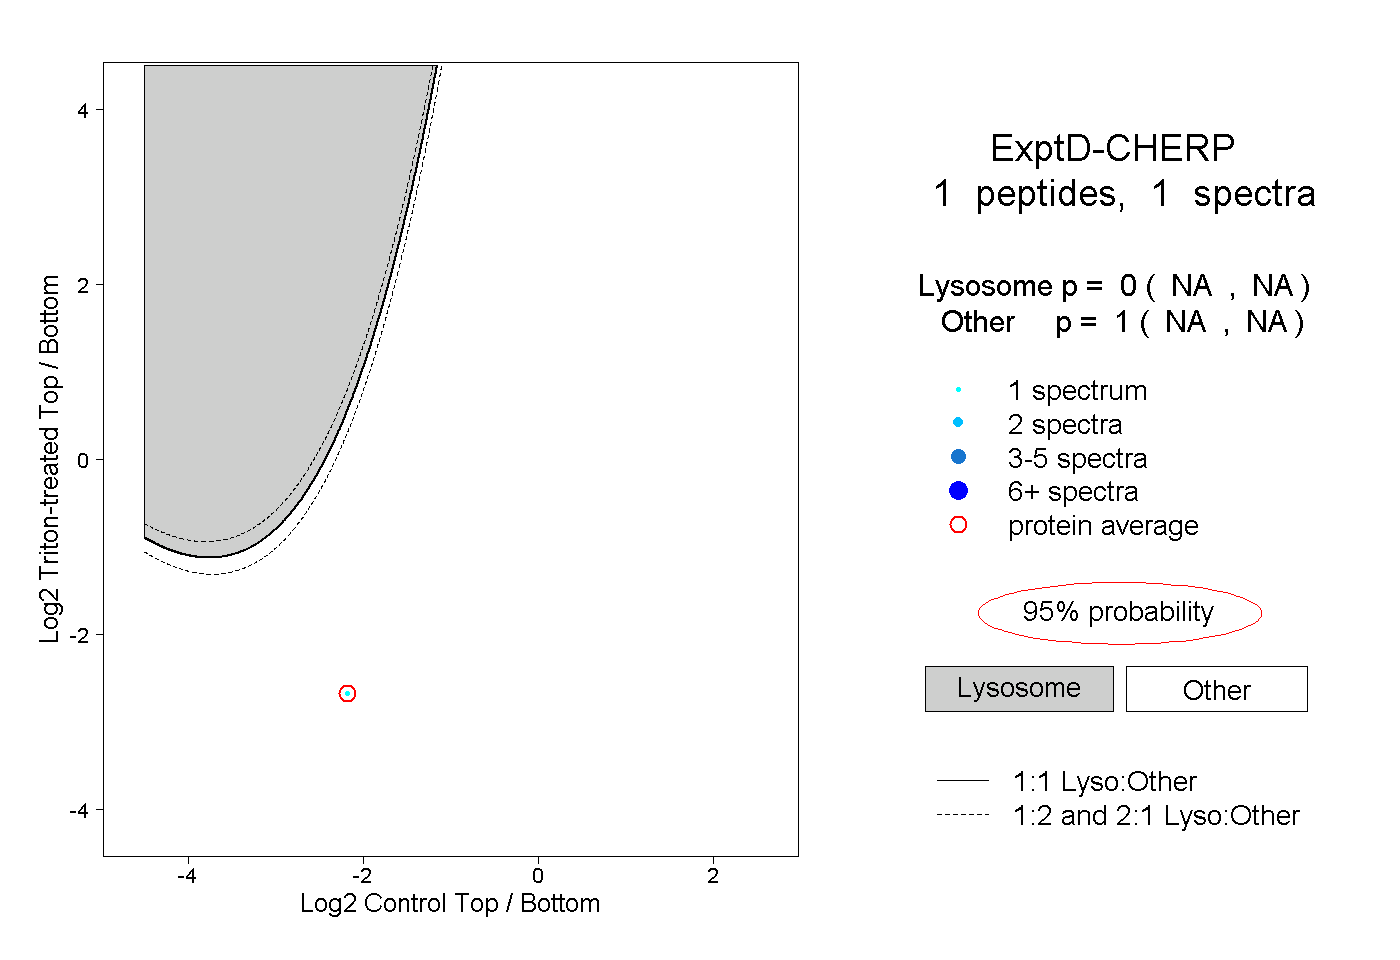 |
0.000 NA | NA |
1.000 NA | NA |