 16
16peptides
spectra
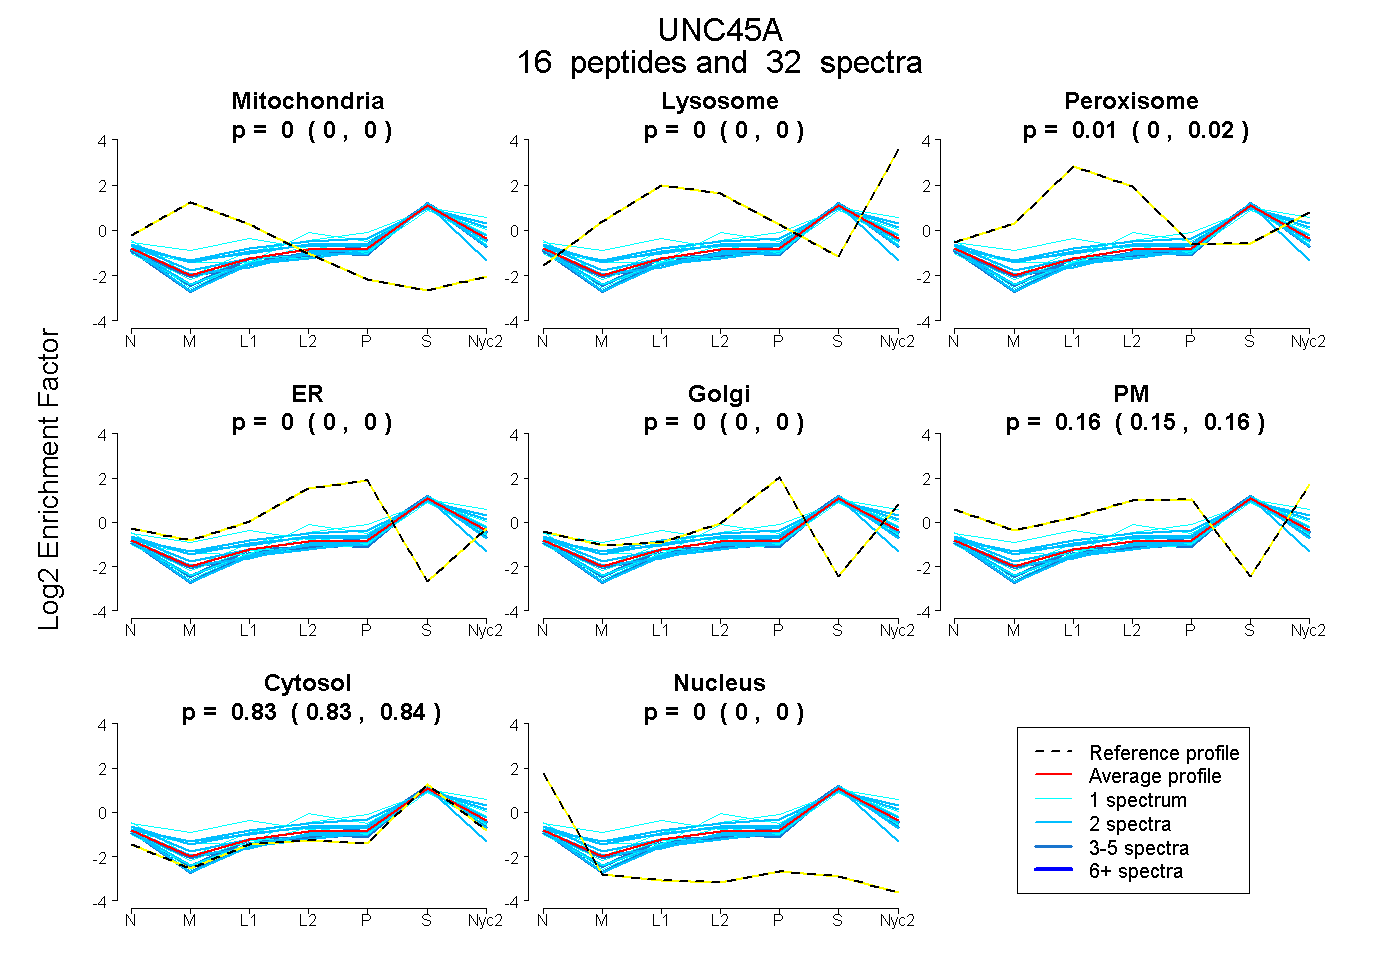
0.000 | 0.000
0.000 | 0.000
0.003 | 0.016
0.000 | 0.000
0.000 | 0.000
0.150 | 0.160
0.829 | 0.838
0.000 | 0.000
5peptides
spectra
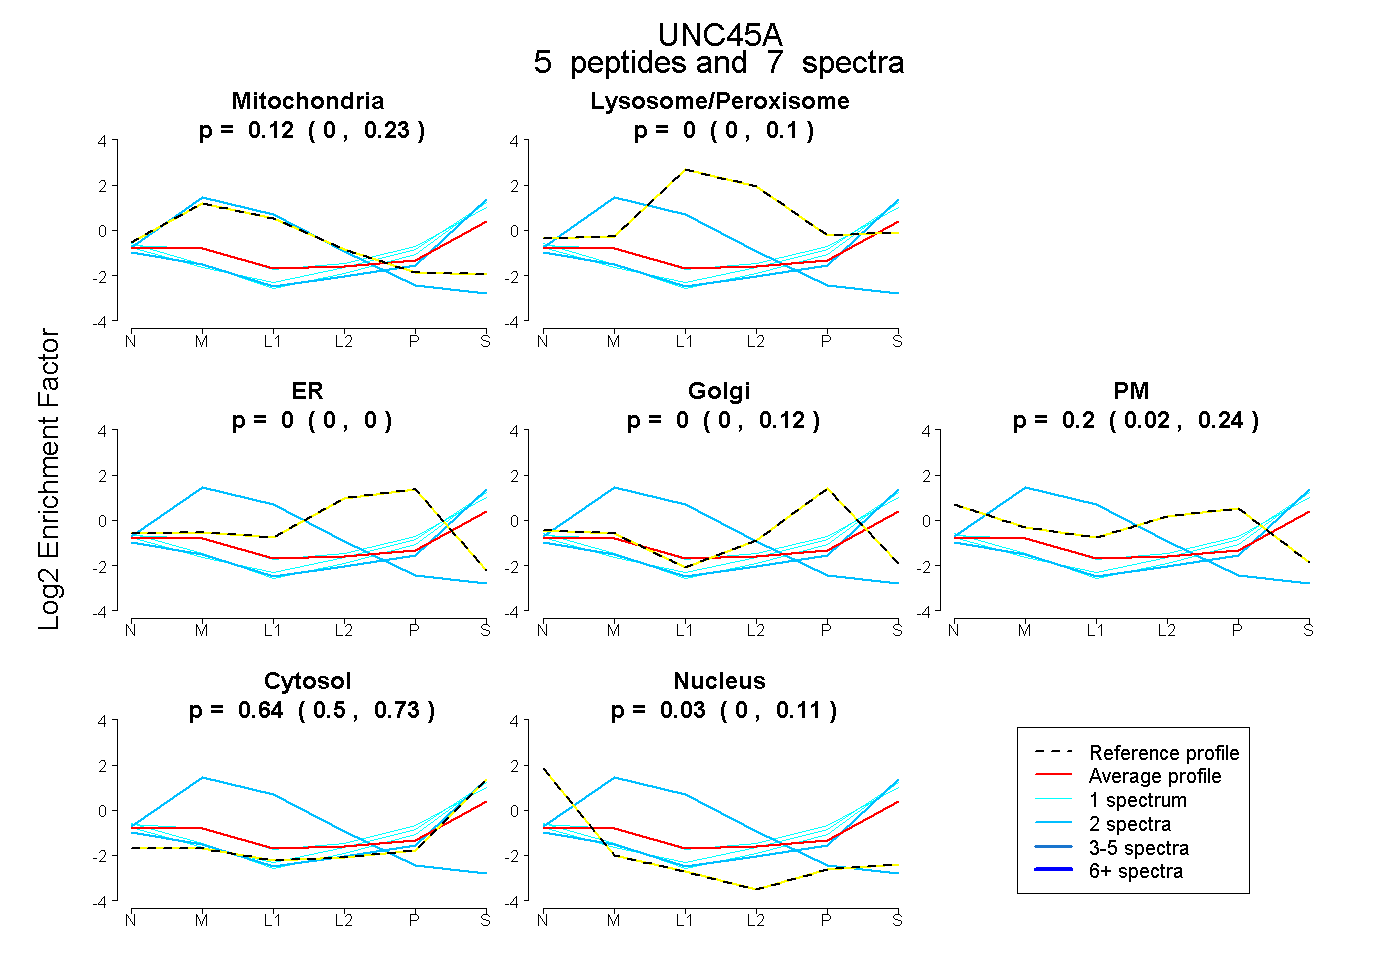
0.000 | 0.226
0.000 | 0.097
0.000 | 0.000
0.000 | 0.115
0.016 | 0.238
0.497 | 0.725
0.000 | 0.108
15peptides
spectra
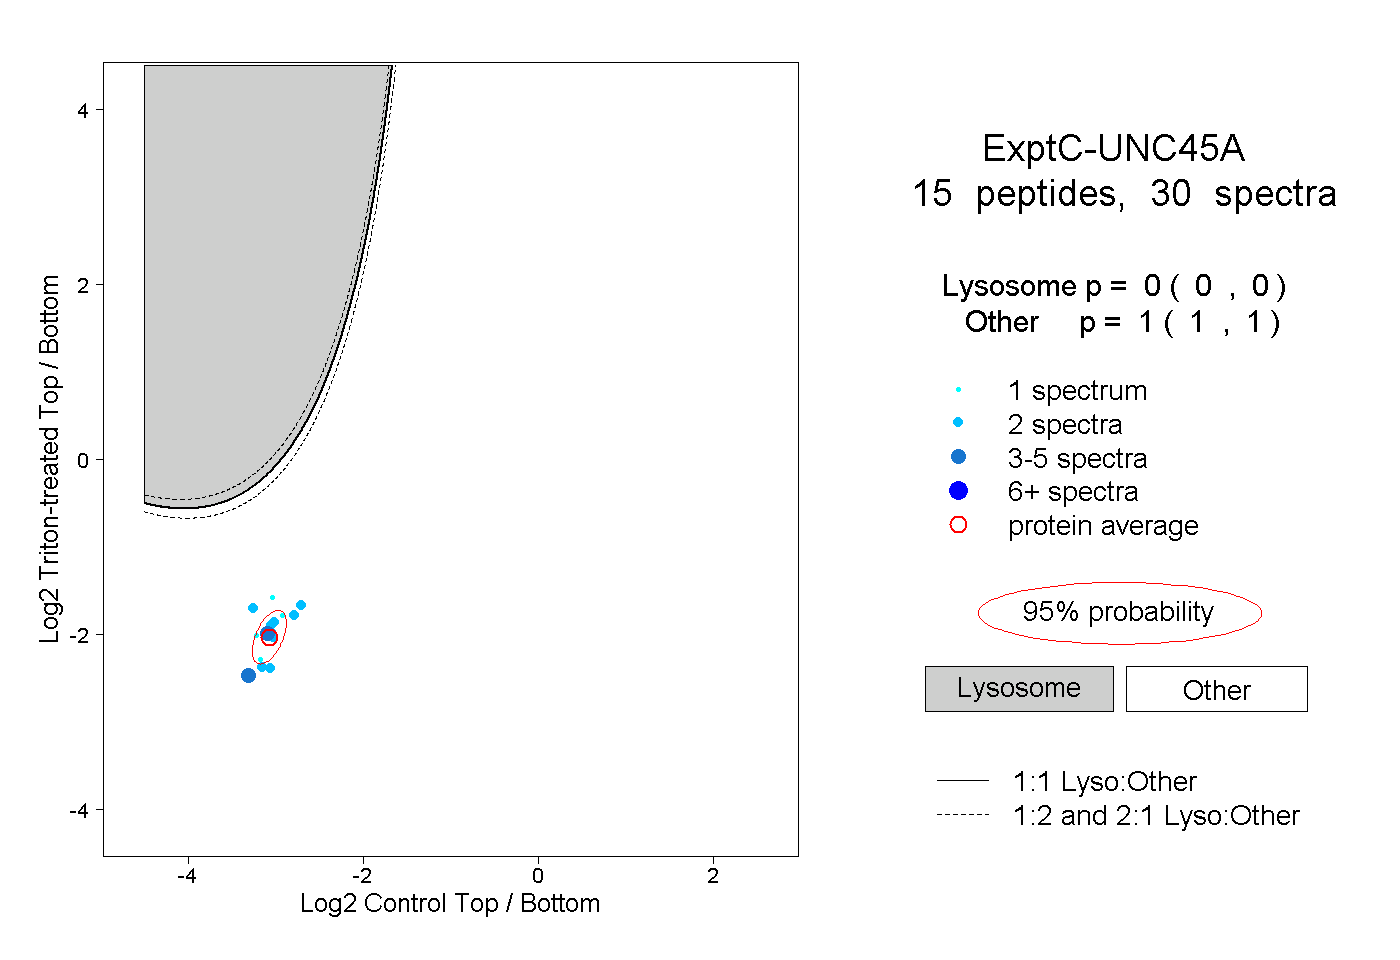
0.000 | 0.000
1.000 | 1.000
1peptide
spectrum
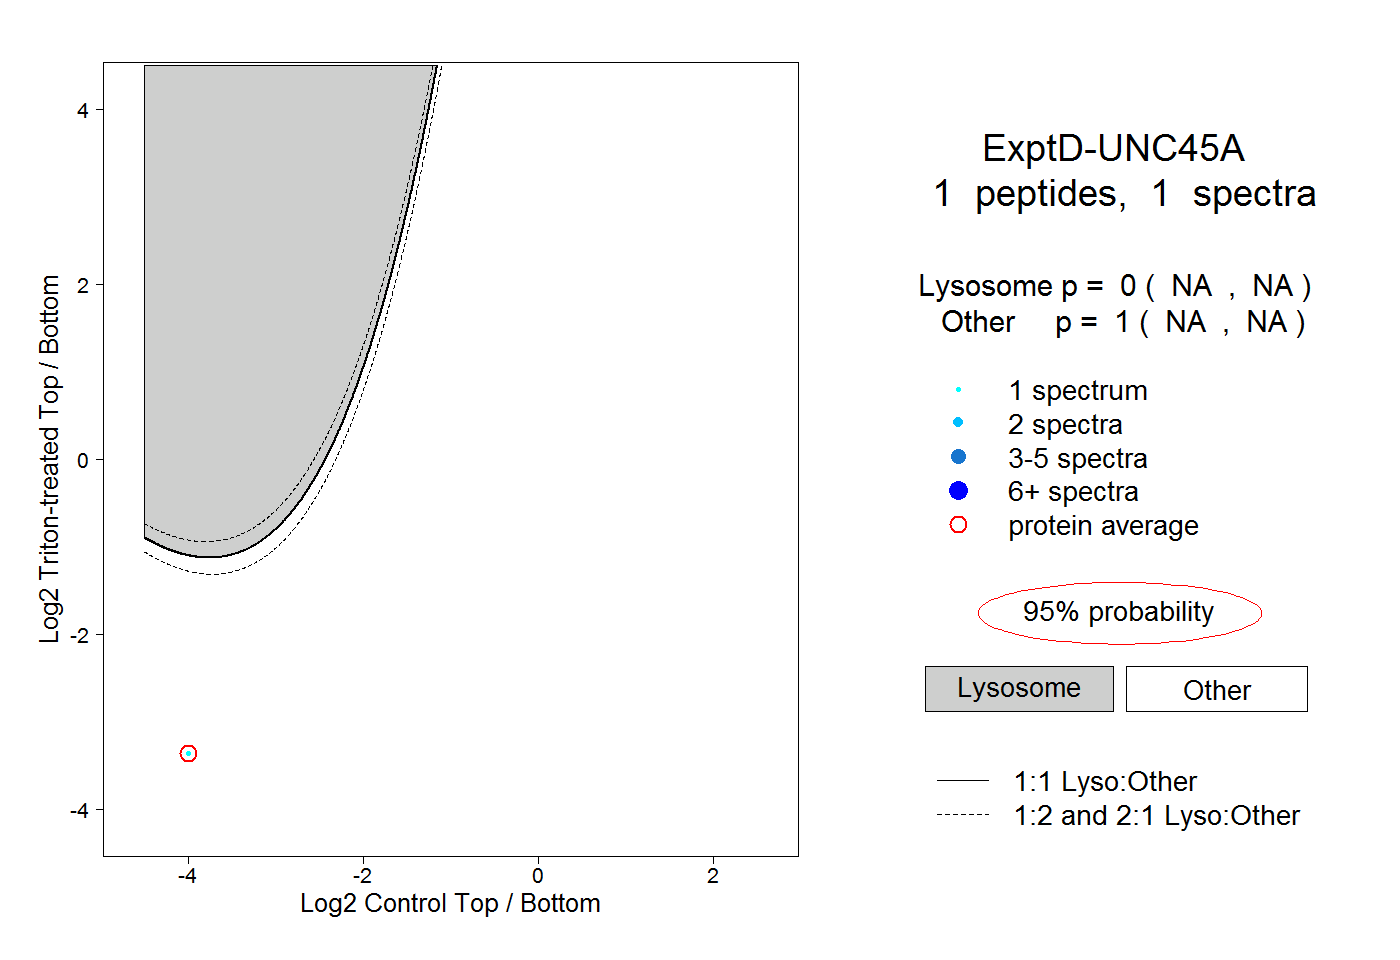
NA | NA
NA | NA