 16
16peptides
spectra
0.000 | 0.000
0.000 | 0.000
0.003 | 0.016
0.000 | 0.000
0.000 | 0.000
0.150 | 0.160
0.829 | 0.838
0.000 | 0.000
| Plot | Mito | Lyso | Perox | ER | Golgi | PM | Cytosol | Nucleus | |||||
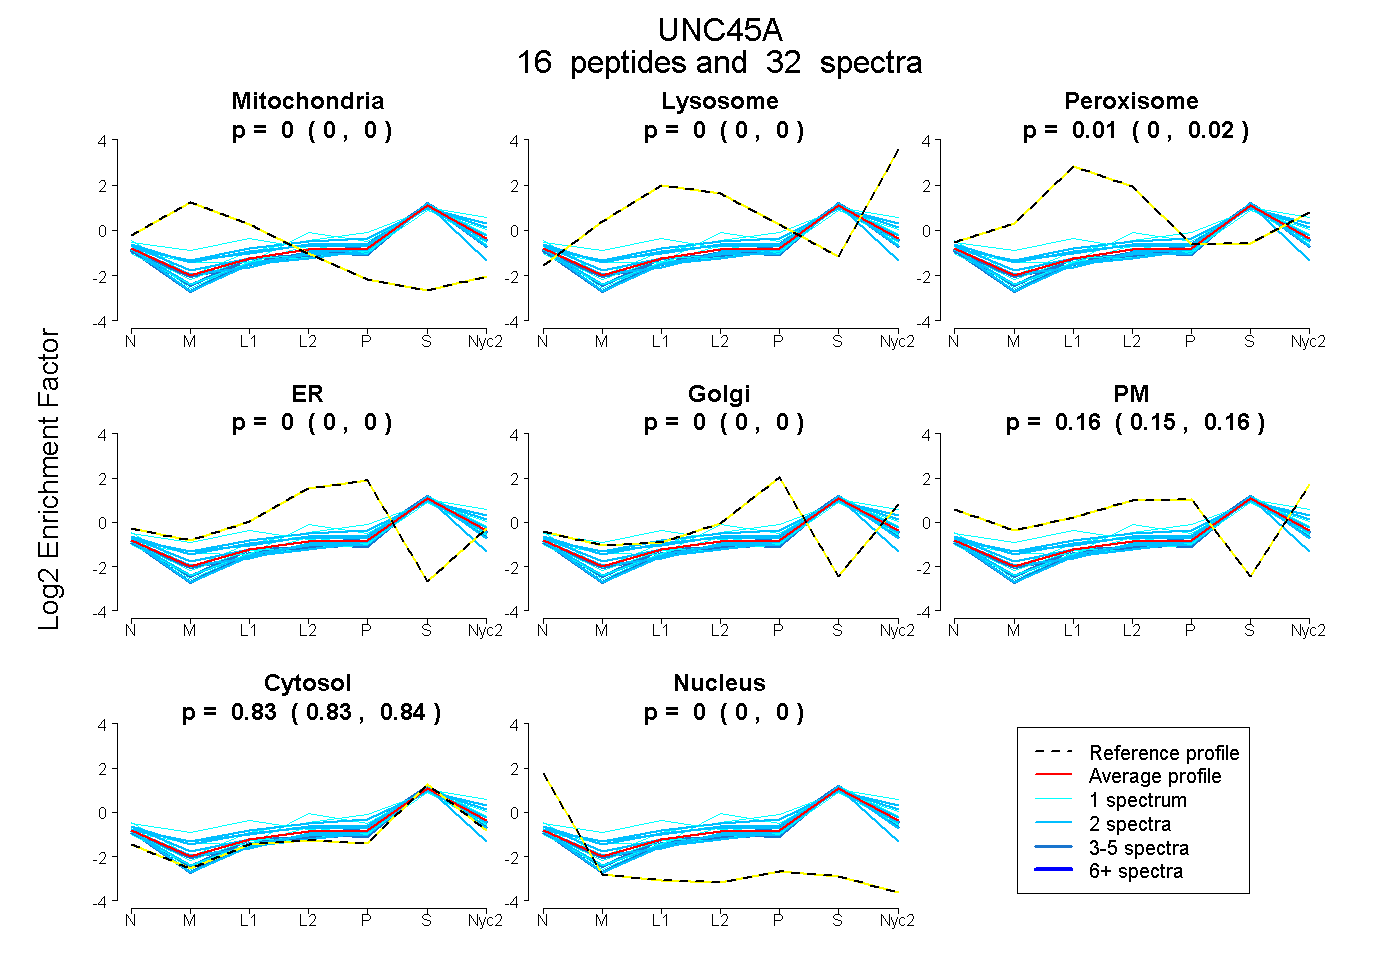
| Expt A |
16 peptides |
32 spectra |
|
0.000 0.000 | 0.000 |
0.000 0.000 | 0.000 |
0.010 0.003 | 0.016 |
0.000 0.000 | 0.000 |
0.000 0.000 | 0.000 |
0.156 0.150 | 0.160 |
0.834 0.829 | 0.838 |
0.000 0.000 | 0.000 |
| 3 spectra, ALFQLSR | 0.000 | 0.000 | 0.000 | 0.000 | 0.000 | 0.109 | 0.891 | 0.000 | ||
| 1 spectrum, ASFITANGVALLK | 0.000 | 0.000 | 0.004 | 0.000 | 0.000 | 0.106 | 0.890 | 0.000 | ||
| 1 spectrum, DGGDVK | 0.000 | 0.000 | 0.018 | 0.165 | 0.000 | 0.092 | 0.725 | 0.000 | ||
| 5 spectra, AAAGGLAMLTSMRPSLCSR | 0.000 | 0.000 | 0.000 | 0.000 | 0.000 | 0.086 | 0.908 | 0.006 | ||
| 2 spectra, EVQDLFEAQGNDR | 0.000 | 0.000 | 0.030 | 0.000 | 0.000 | 0.156 | 0.814 | 0.000 | ||
| 2 spectra, LEDYSK | 0.000 | 0.000 | 0.000 | 0.000 | 0.069 | 0.000 | 0.907 | 0.024 | ||
| 2 spectra, TESPVLTNSCR | 0.009 | 0.000 | 0.000 | 0.094 | 0.000 | 0.000 | 0.850 | 0.047 | ||
| 1 spectrum, LTITSNPEMTFPGER | 0.070 | 0.080 | 0.154 | 0.000 | 0.000 | 0.060 | 0.636 | 0.000 | ||
| 2 spectra, VFLALVEEVEDR | 0.009 | 0.000 | 0.114 | 0.000 | 0.057 | 0.084 | 0.736 | 0.000 | ||
| 2 spectra, GTVVVLNMMESSK | 0.000 | 0.150 | 0.002 | 0.000 | 0.000 | 0.159 | 0.688 | 0.000 | ||
| 1 spectrum, EGNELFK | 0.000 | 0.155 | 0.000 | 0.000 | 0.000 | 0.147 | 0.698 | 0.000 | ||
| 1 spectrum, GEESPVTR | 0.000 | 0.037 | 0.000 | 0.000 | 0.000 | 0.087 | 0.876 | 0.000 | ||
| 1 spectrum, DKPSFVR | 0.000 | 0.000 | 0.000 | 0.000 | 0.007 | 0.078 | 0.895 | 0.021 | ||
| 2 spectra, EGAIIVDPAR | 0.000 | 0.000 | 0.000 | 0.000 | 0.000 | 0.097 | 0.903 | 0.000 | ||
| 2 spectra, TVATLSVLGTR | 0.000 | 0.079 | 0.029 | 0.000 | 0.000 | 0.161 | 0.731 | 0.000 | ||
| 4 spectra, ASQNLVVLAR | 0.000 | 0.000 | 0.000 | 0.000 | 0.123 | 0.000 | 0.877 | 0.000 |
| Plot | Mito | Lyso or Perox | ER | Golgi | PM | Cytosol | Nucleus | ||||||
| Expt B |
5 peptides |
7 spectra |
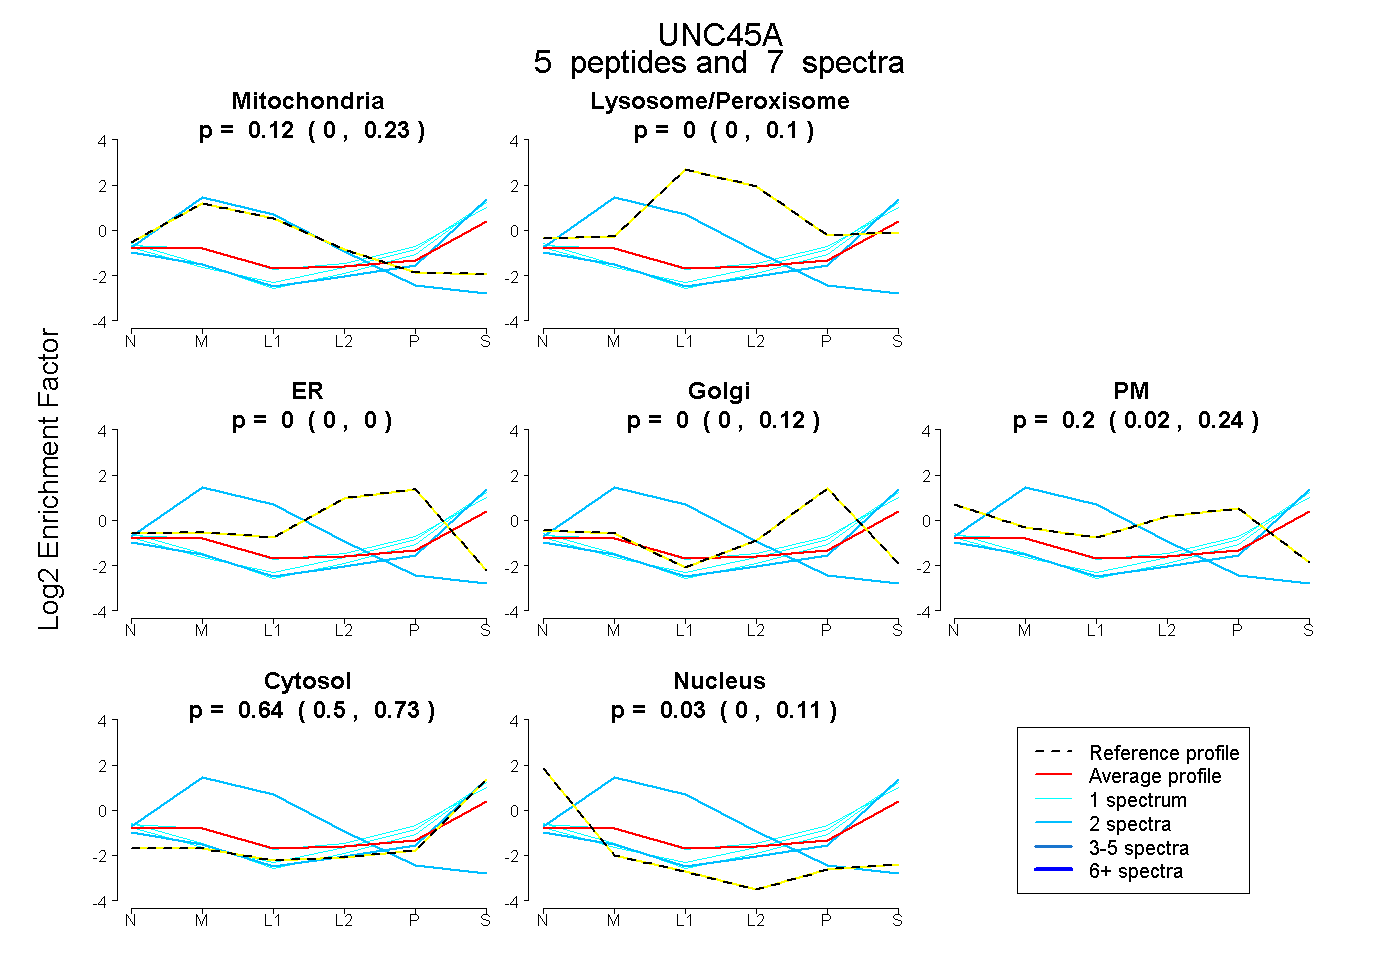 |
0.125 0.000 | 0.226 |
0.000 0.000 | 0.097 |
0.000 0.000 | 0.000 |
0.000 0.000 | 0.115 |
0.199 0.016 | 0.238 |
0.644 0.497 | 0.725 |
0.032 0.000 | 0.108 |
|||
| Plot | Lyso | Other | |||||||||||
| Expt C |
15 peptides |
30 spectra |
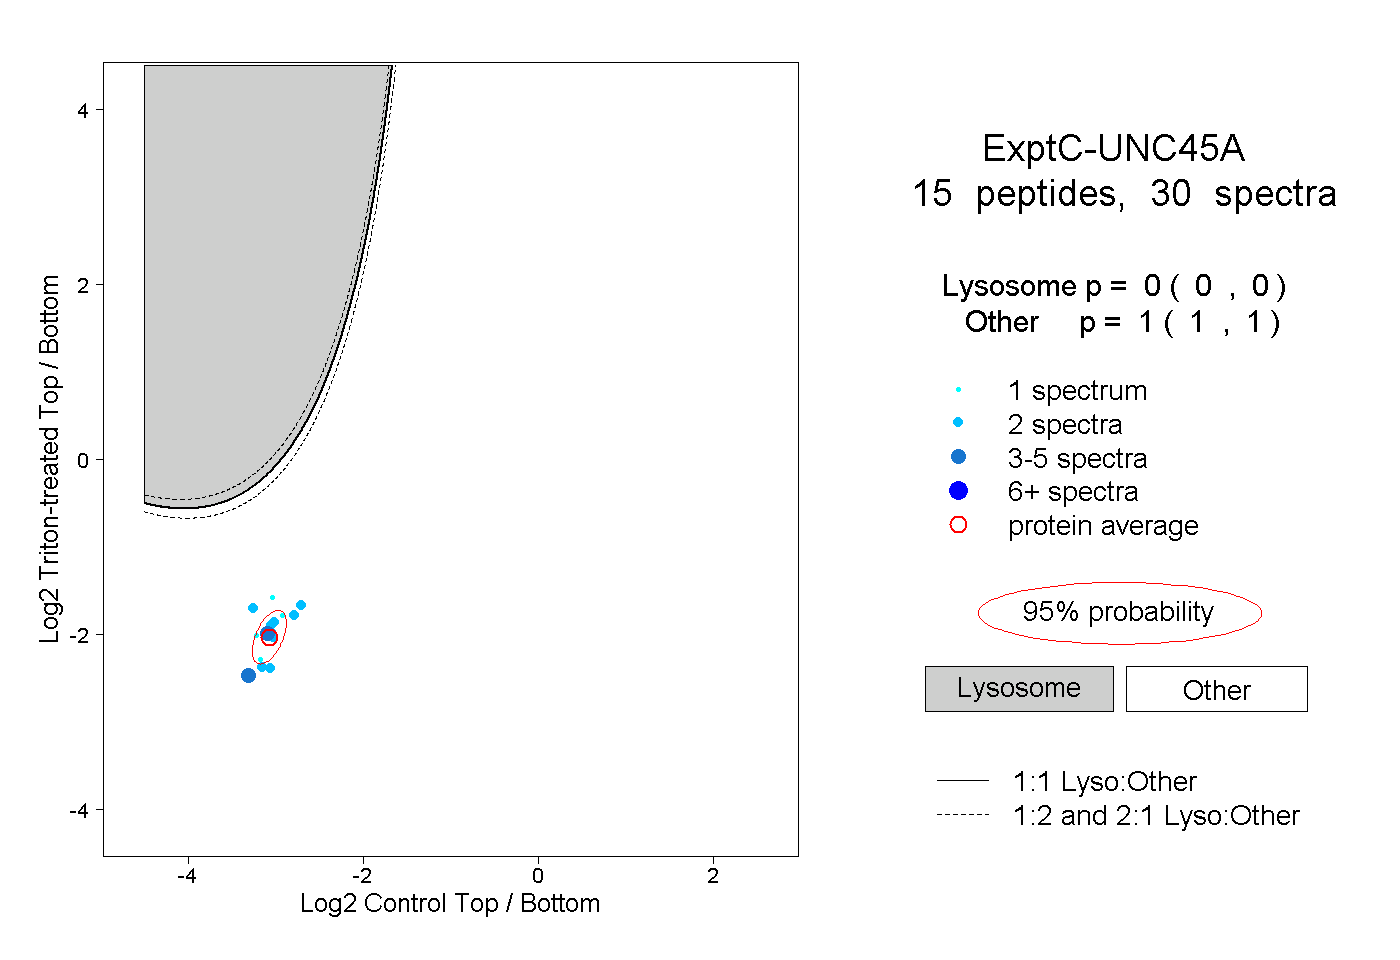 |
0.000 0.000 | 0.000 |
1.000 1.000 | 1.000 |
||||||||
| Plot | Lyso | Other | |||||||||||
| Expt D |
1 peptide |
1 spectrum |
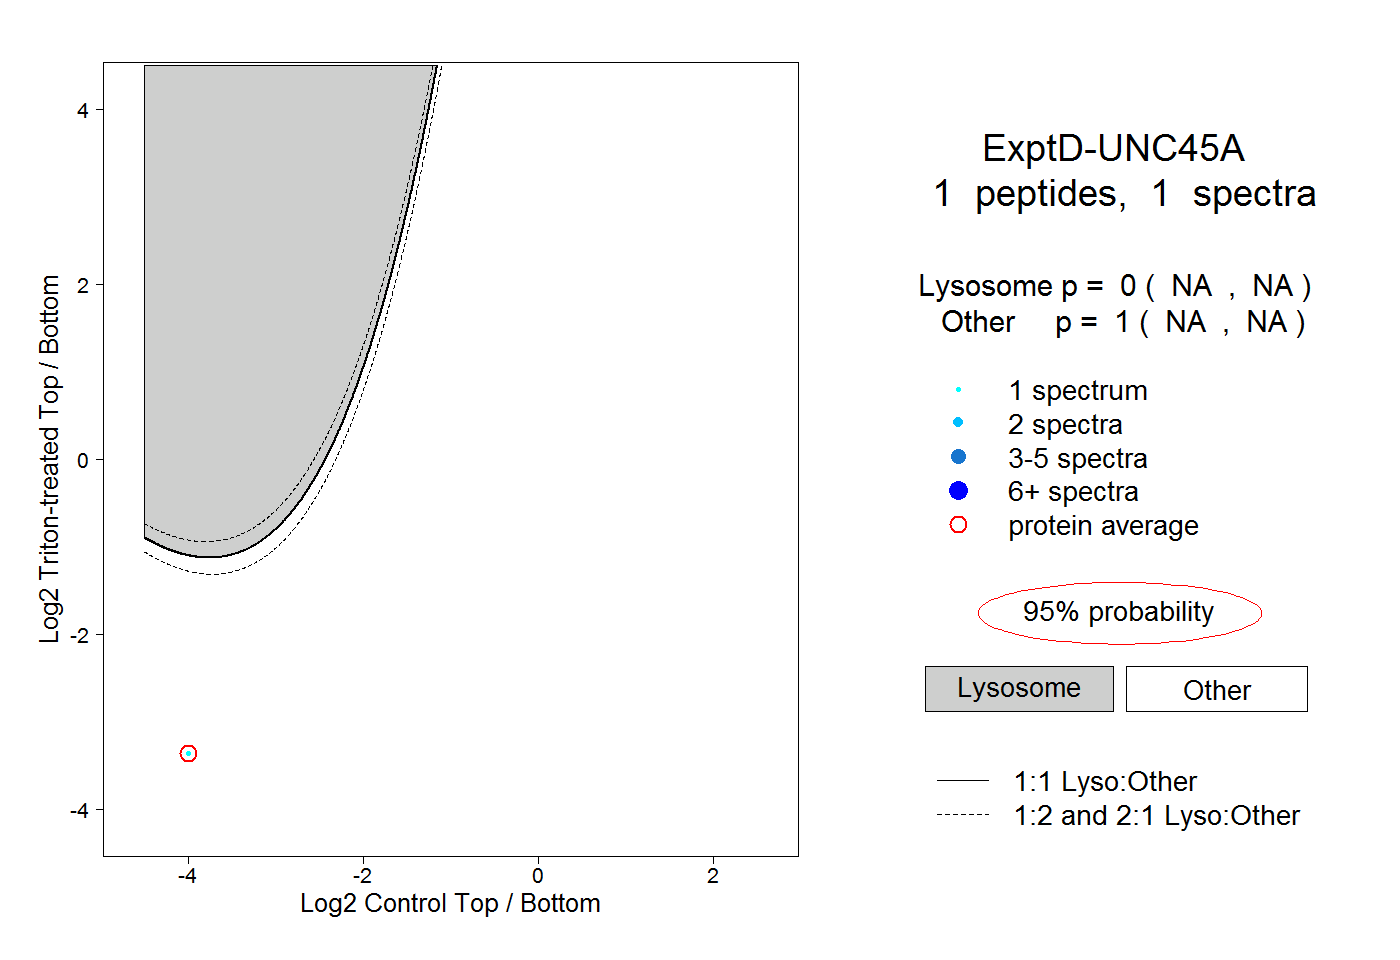 |
0.000 NA | NA |
1.000 NA | NA |