 12
12peptides
spectra
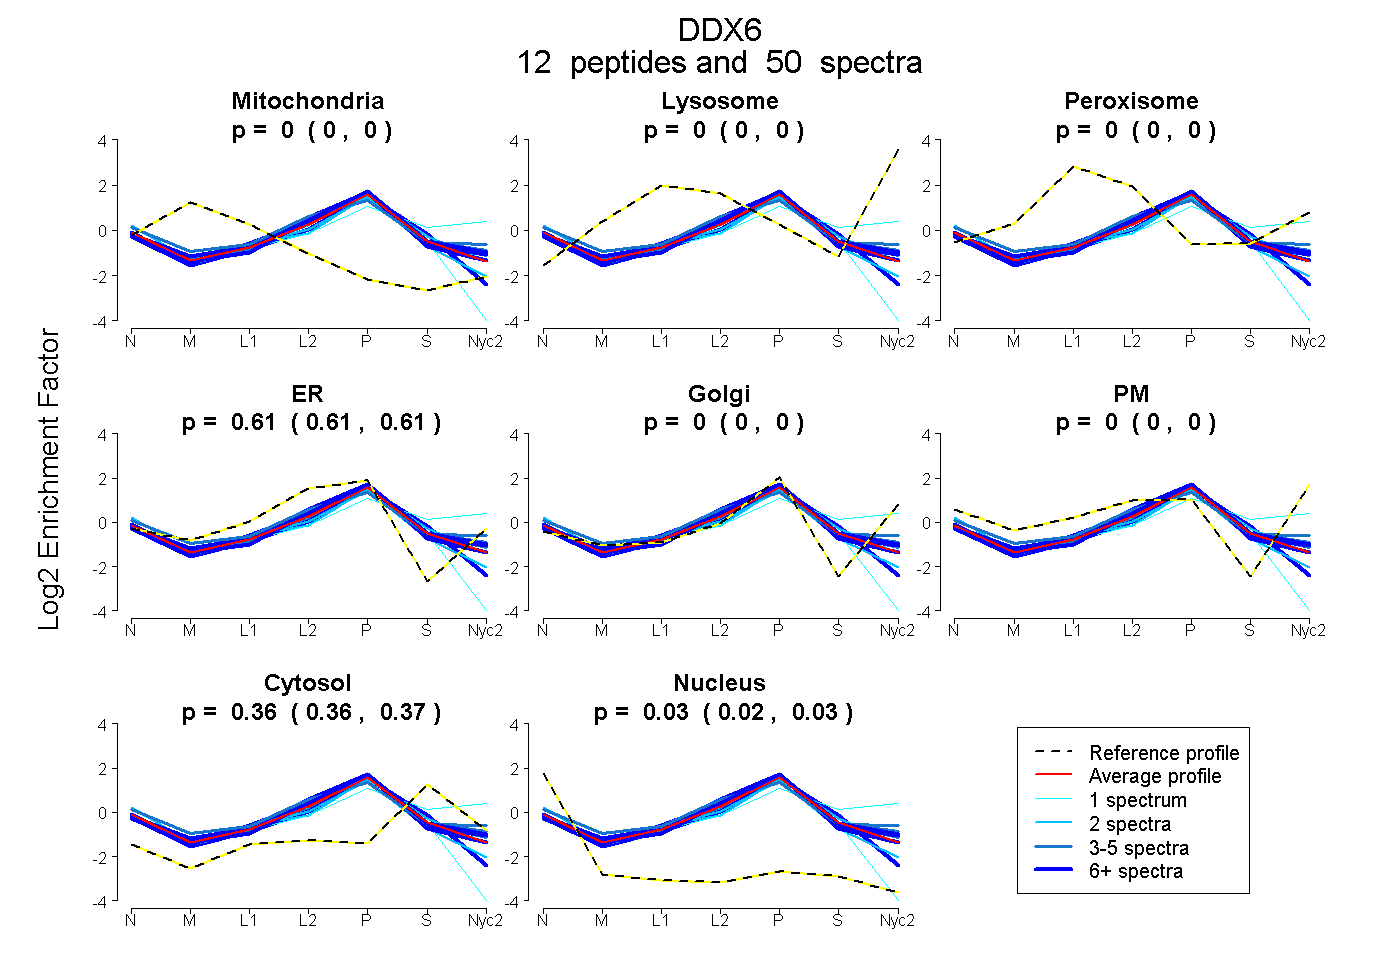
0.000 | 0.000
0.000 | 0.000
0.000 | 0.000
0.607 | 0.612
0.000 | 0.000
0.000 | 0.000
0.358 | 0.366
0.023 | 0.032
7peptides
spectra
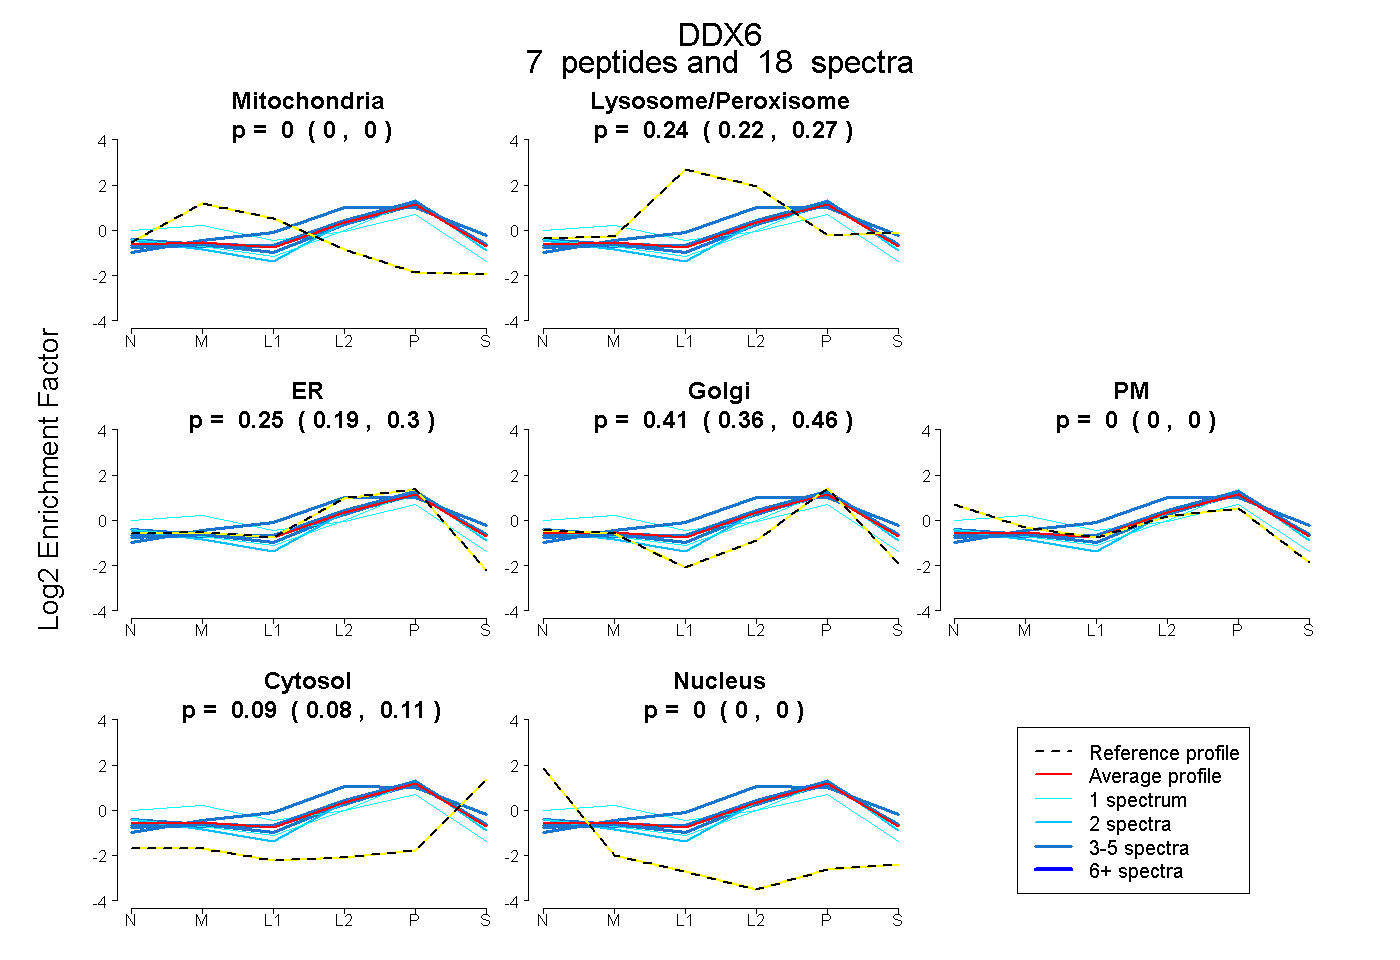
0.000 | 0.000
0.217 | 0.266
0.186 | 0.302
0.360 | 0.460
0.000 | 0.000
0.077 | 0.107
0.000 | 0.000
14peptides
spectra
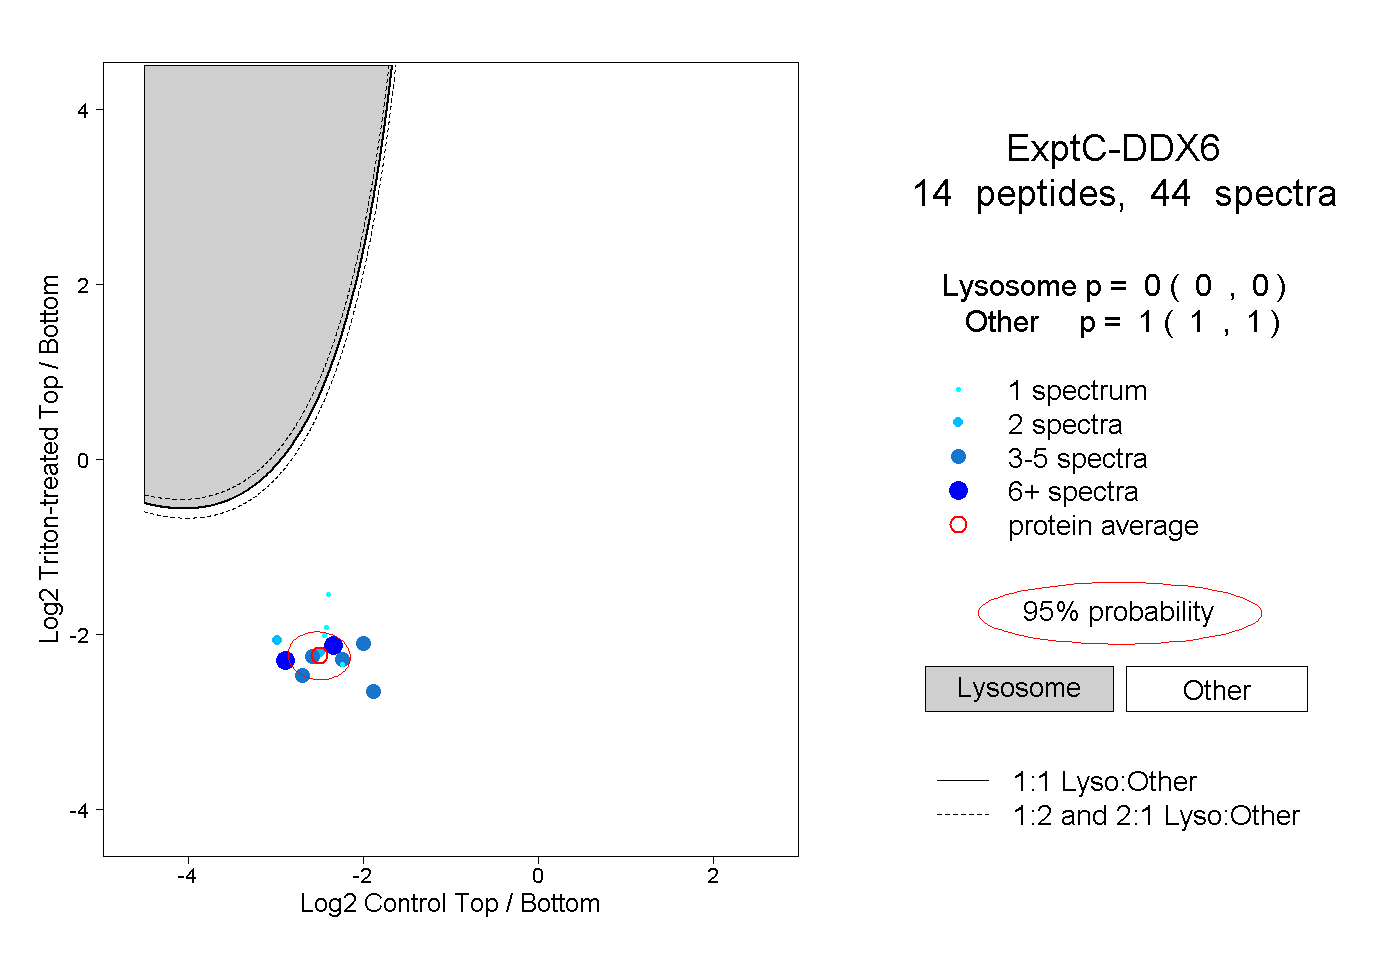
0.000 | 0.000
1.000 | 1.000
5peptides
spectra
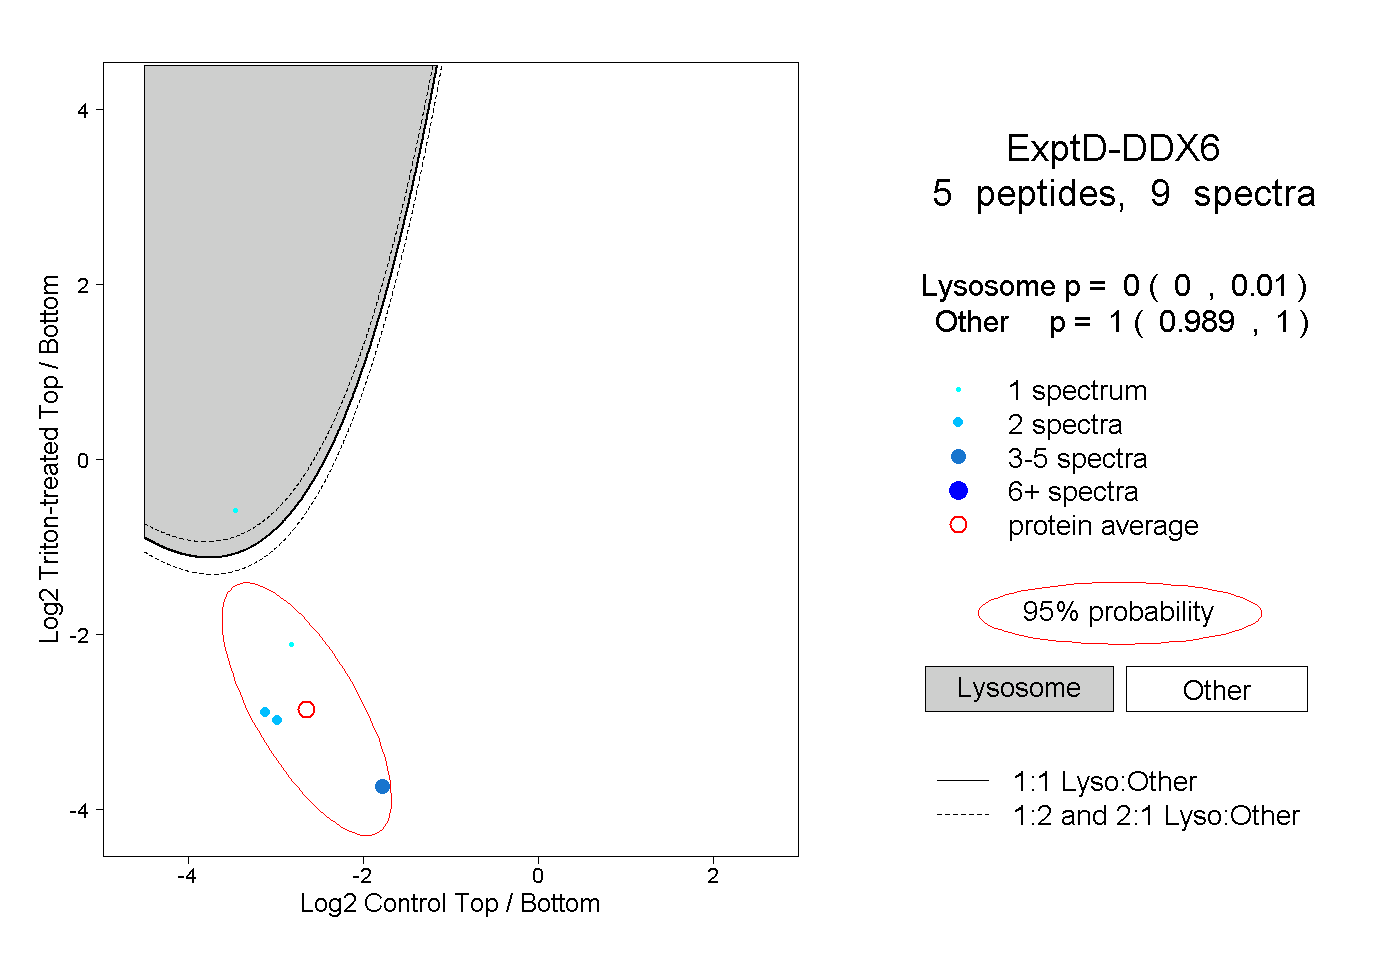
0.000 | 0.010
0.989 | 1.000