 12
12peptides
spectra
0.000 | 0.000
0.000 | 0.000
0.000 | 0.000
0.607 | 0.612
0.000 | 0.000
0.000 | 0.000
0.358 | 0.366
0.023 | 0.032
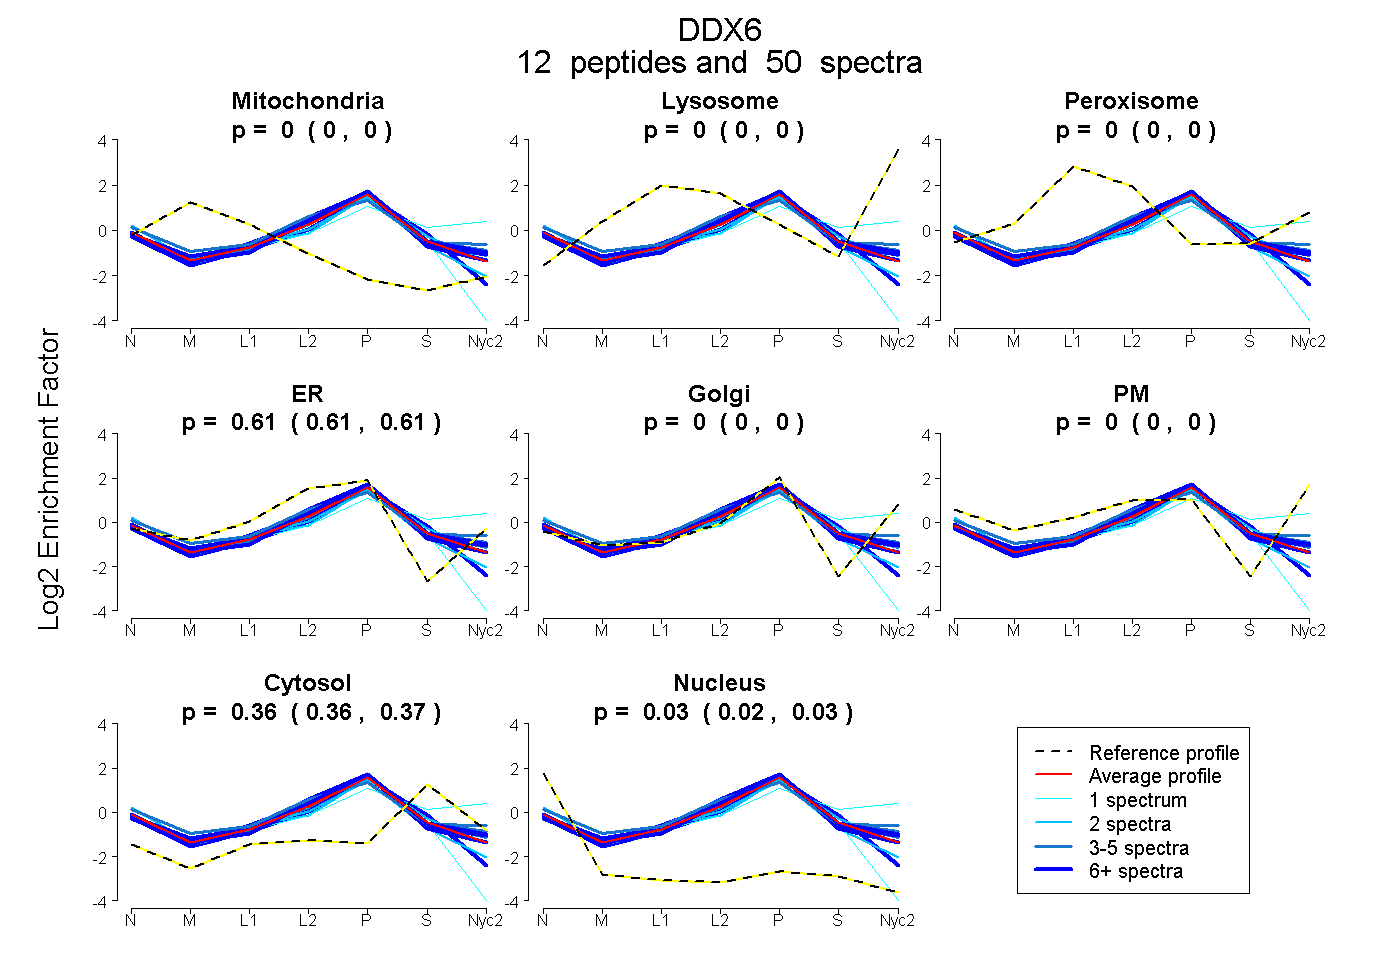
| Plot | Mito | Lyso | Perox | ER | Golgi | PM | Cytosol | Nucleus | |||||
| Expt A |
12 peptides |
50 spectra |
|
0.000 0.000 | 0.000 |
0.000 0.000 | 0.000 |
0.000 0.000 | 0.000 |
0.610 0.607 | 0.612 |
0.000 0.000 | 0.000 |
0.000 0.000 | 0.000 |
0.363 0.358 | 0.366 |
0.028 0.023 | 0.032 |
| 2 spectra, GVTQYYAYVTER | 0.000 | 0.000 | 0.000 | 0.561 | 0.000 | 0.000 | 0.410 | 0.029 | ||
| 4 spectra, VEILAK | 0.000 | 0.000 | 0.000 | 0.564 | 0.076 | 0.000 | 0.360 | 0.000 | ||
| 7 spectra, NLVCTDLFTR | 0.000 | 0.000 | 0.000 | 0.672 | 0.000 | 0.000 | 0.311 | 0.017 | ||
| 1 spectrum, TSDVTSTK | 0.000 | 0.000 | 0.025 | 0.000 | 0.325 | 0.229 | 0.420 | 0.000 | ||
| 6 spectra, VFHDFR | 0.000 | 0.000 | 0.000 | 0.657 | 0.002 | 0.000 | 0.337 | 0.004 | ||
| 6 spectra, VMATTGGTNLR | 0.000 | 0.000 | 0.000 | 0.570 | 0.070 | 0.000 | 0.359 | 0.000 | ||
| 4 spectra, VHCLNTLFSR | 0.000 | 0.000 | 0.000 | 0.624 | 0.000 | 0.040 | 0.336 | 0.000 | ||
| 1 spectrum, SGAYLIPLLER | 0.000 | 0.000 | 0.000 | 0.627 | 0.034 | 0.000 | 0.338 | 0.001 | ||
| 3 spectra, DNIQAMVIVPTR | 0.000 | 0.000 | 0.000 | 0.592 | 0.031 | 0.000 | 0.364 | 0.013 | ||
| 13 spectra, GNEFEDYCLK | 0.000 | 0.000 | 0.000 | 0.524 | 0.000 | 0.000 | 0.394 | 0.082 | ||
| 2 spectra, LDDTVHVVIATPGR | 0.000 | 0.000 | 0.000 | 0.599 | 0.000 | 0.000 | 0.272 | 0.130 | ||
| 1 spectrum, LQINQSIIFCNSSQR | 0.000 | 0.000 | 0.000 | 0.551 | 0.000 | 0.000 | 0.238 | 0.211 |
| Plot | Mito | Lyso or Perox | ER | Golgi | PM | Cytosol | Nucleus | ||||||
| Expt B |
7 peptides |
18 spectra |
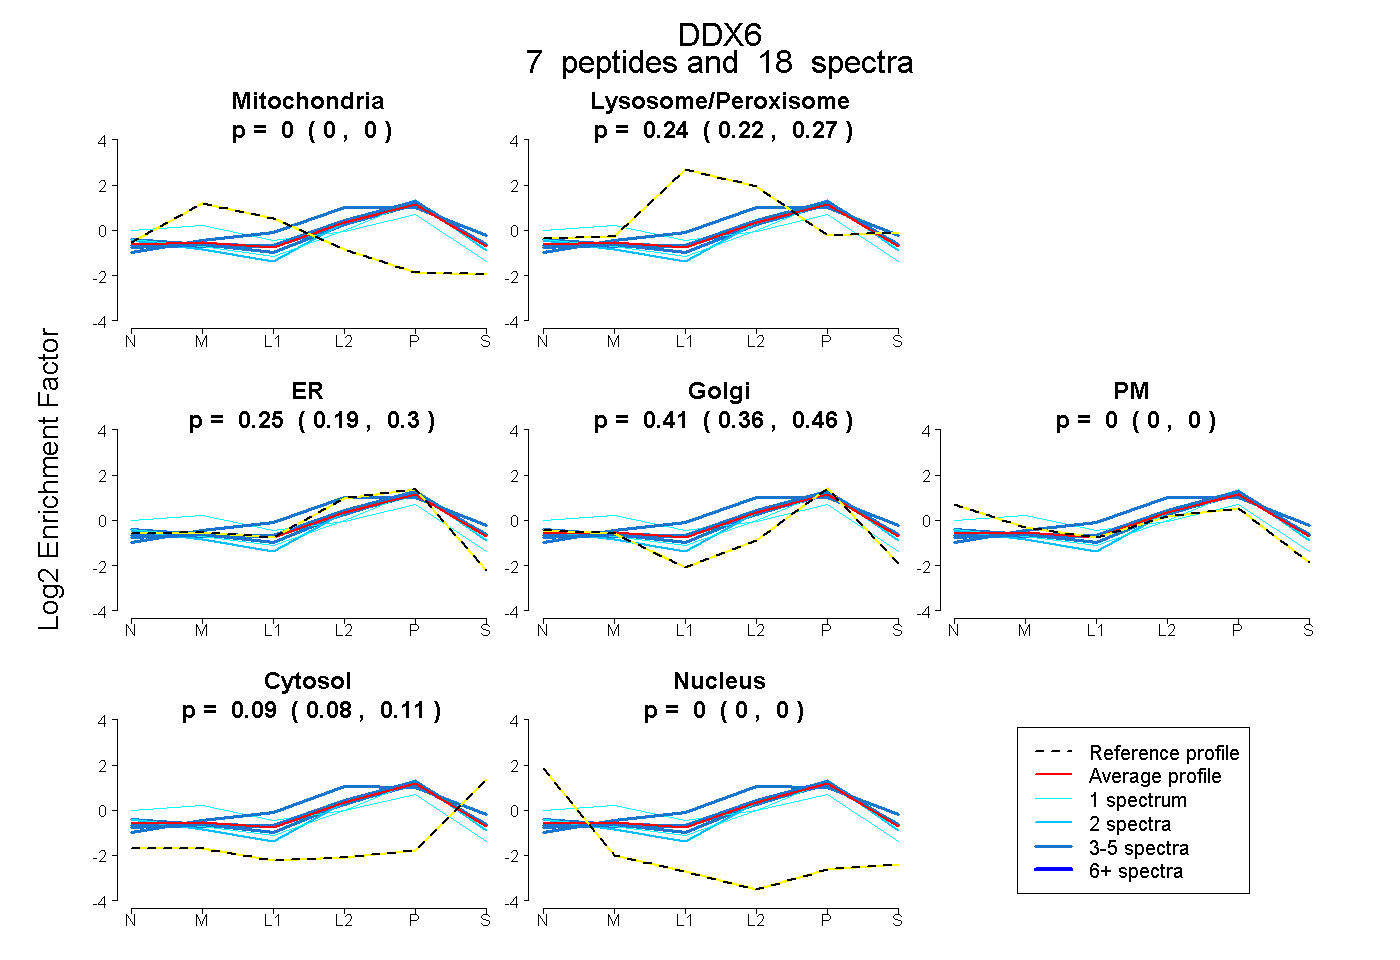 |
0.000 0.000 | 0.000 |
0.245 0.217 | 0.266 |
0.248 0.186 | 0.302 |
0.415 0.360 | 0.460 |
0.000 0.000 | 0.000 |
0.092 0.077 | 0.107 |
0.000 0.000 | 0.000 |
|||
| Plot | Lyso | Other | |||||||||||
| Expt C |
14 peptides |
44 spectra |
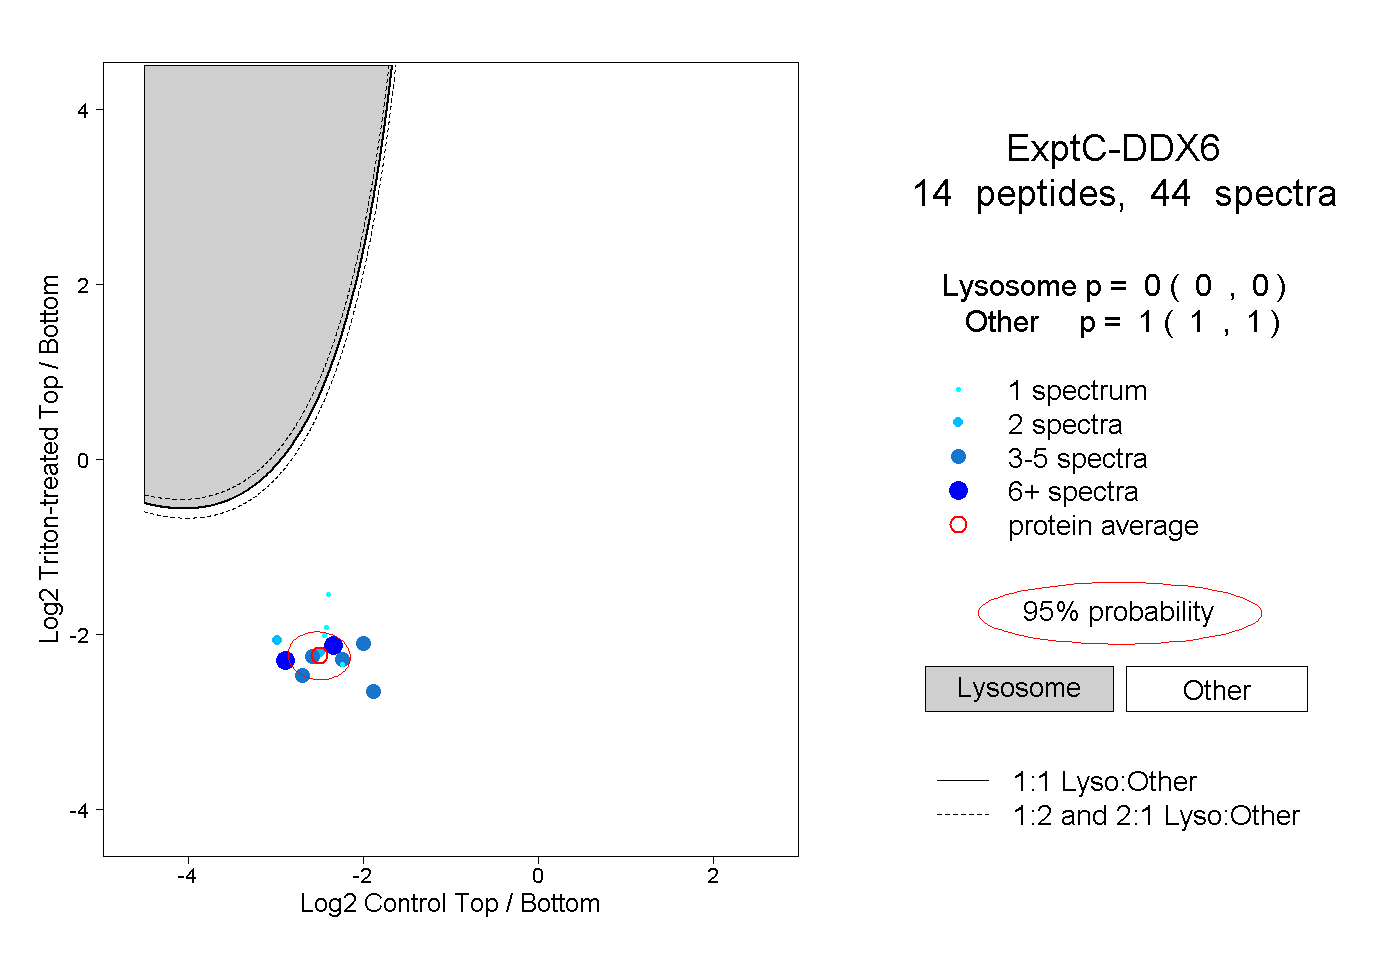 |
0.000 0.000 | 0.000 |
1.000 1.000 | 1.000 |
||||||||
| Plot | Lyso | Other | |||||||||||
| Expt D |
5 peptides |
9 spectra |
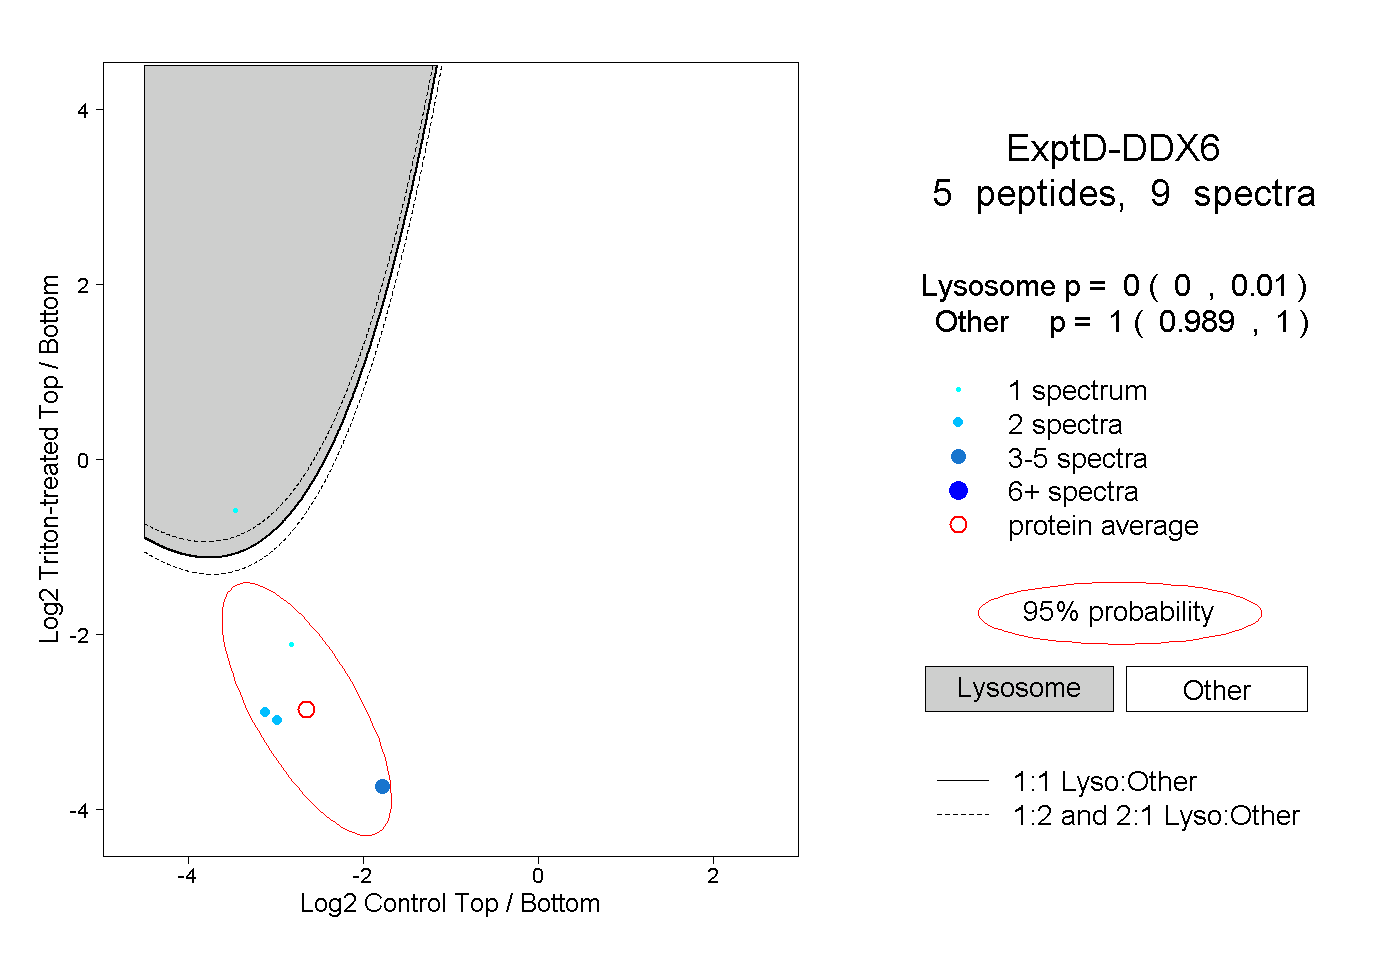 |
0.000 0.000 | 0.010 |
1.000 0.989 | 1.000 |