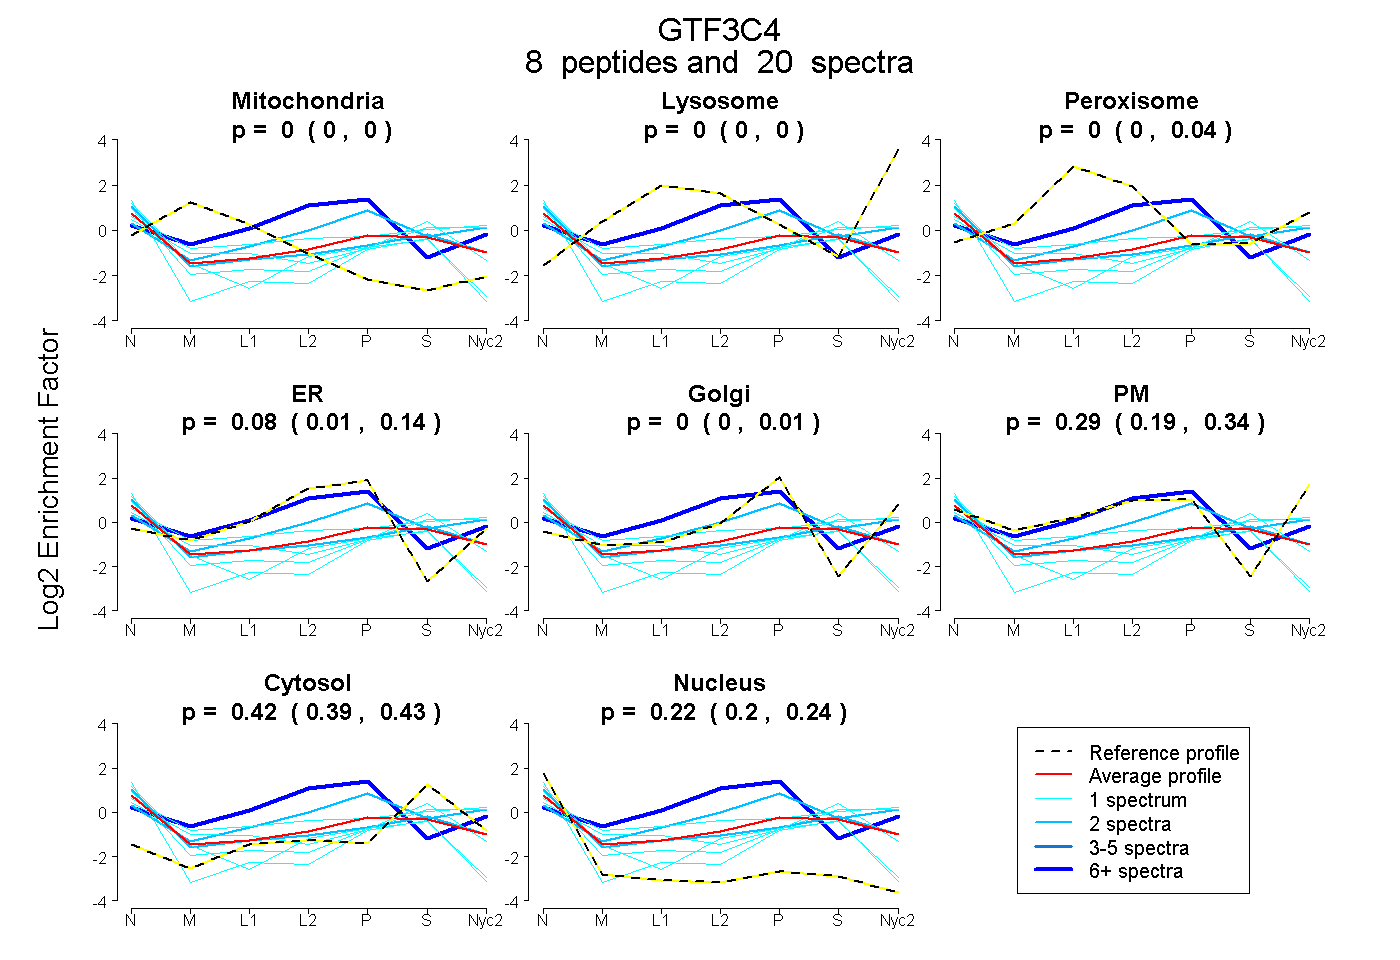
 8
8peptides
spectra
0.000 | 0.000
0.000 | 0.000
0.000 | 0.036
0.011 | 0.143
0.000 | 0.012
0.195 | 0.341
0.391 | 0.428
0.198 | 0.238
3peptides
spectra
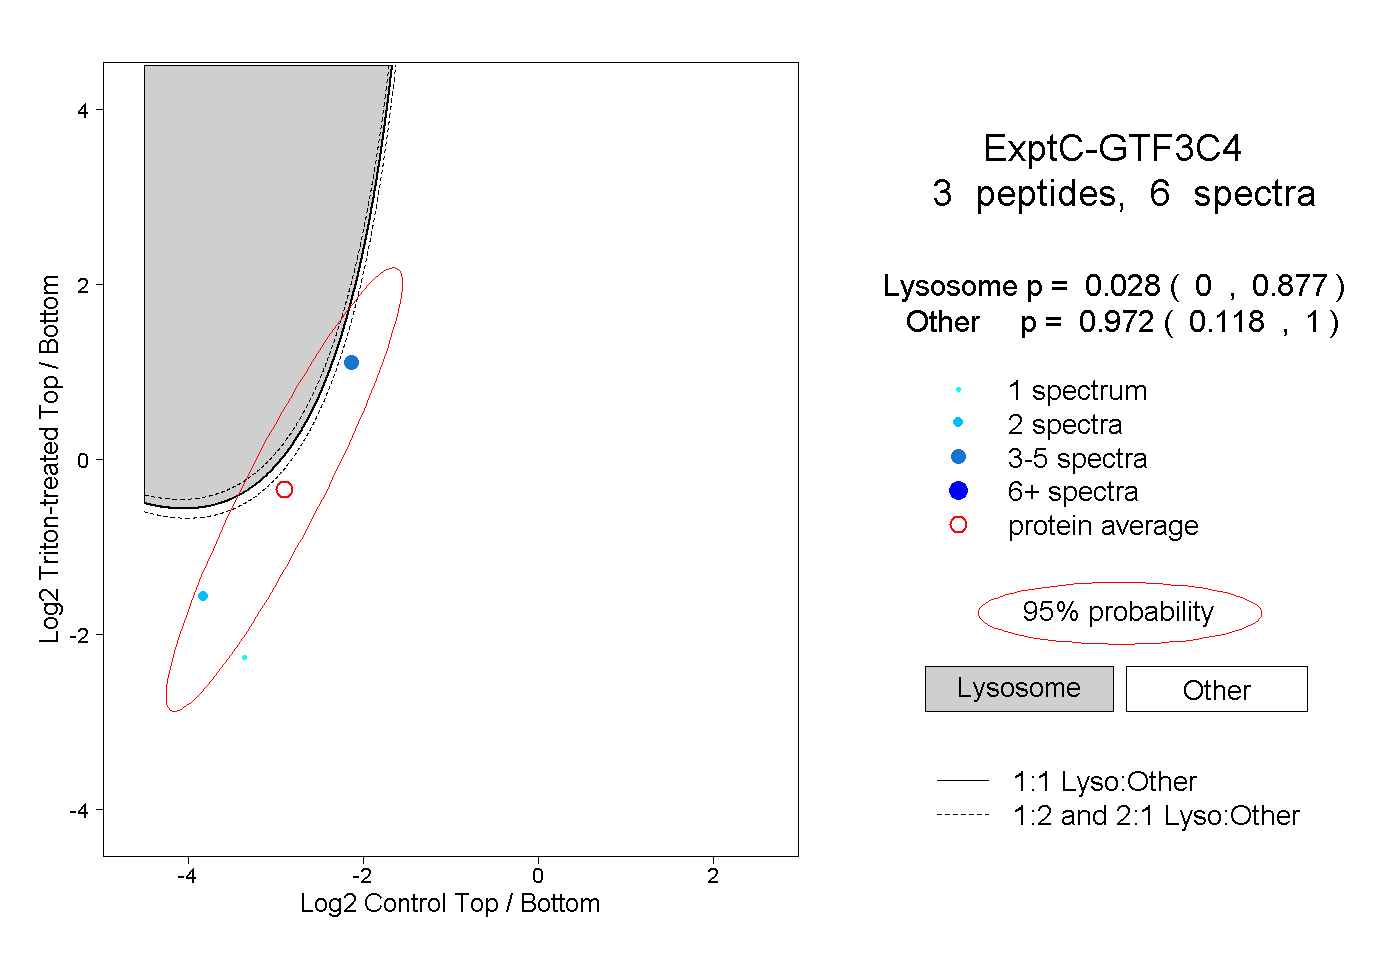
0.000 | 0.877
0.118 | 1.000
| Plot | Mito | Lyso | Perox | ER | Golgi | PM | Cytosol | Nucleus | |||||
| Expt A |
8 peptides |
20 spectra |
|
0.000 0.000 | 0.000 |
0.000 0.000 | 0.000 |
0.000 0.000 | 0.036 |
0.081 0.011 | 0.143 |
0.000 0.000 | 0.012 |
0.286 0.195 | 0.341 |
0.416 0.391 | 0.428 |
0.217 0.198 | 0.238 |
||
| Plot | Lyso | Other | |||||||||||
| Expt C |
3 peptides |
6 spectra |
|
0.028 0.000 | 0.877 |
0.972 0.118 | 1.000 |