 8
8peptides
spectra
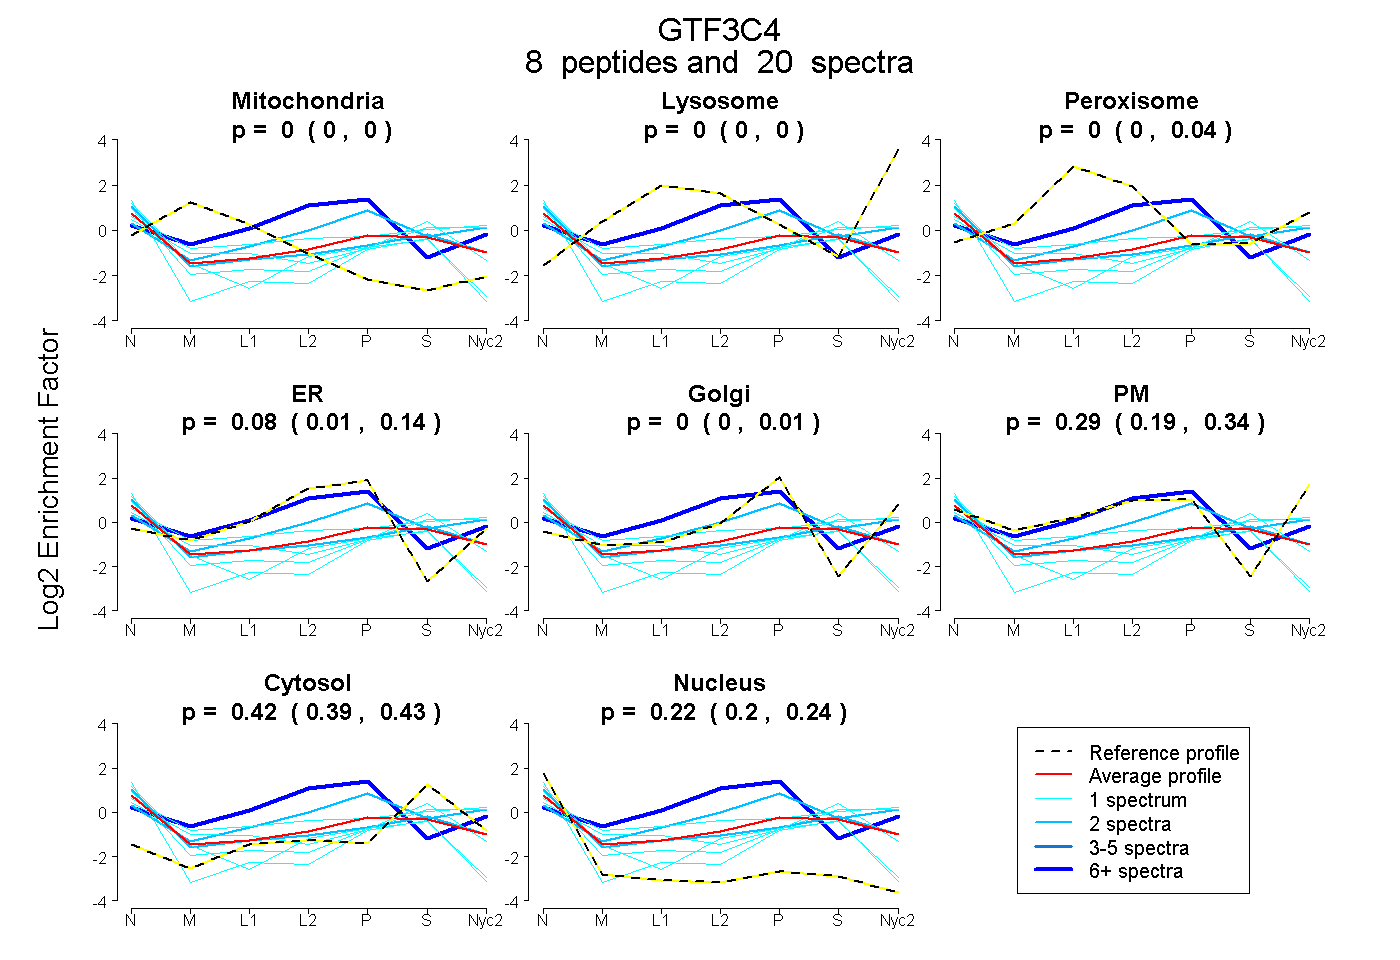
0.000 | 0.000
0.000 | 0.000
0.000 | 0.036
0.011 | 0.143
0.000 | 0.012
0.195 | 0.341
0.391 | 0.428
0.198 | 0.238
| Plot | Mito | Lyso | Perox | ER | Golgi | PM | Cytosol | Nucleus | |||||
| Expt A |
8 peptides |
20 spectra |
|
0.000 0.000 | 0.000 |
0.000 0.000 | 0.000 |
0.000 0.000 | 0.036 |
0.081 0.011 | 0.143 |
0.000 0.000 | 0.012 |
0.286 0.195 | 0.341 |
0.416 0.391 | 0.428 |
0.217 0.198 | 0.238 |
| 1 spectrum, EAAADAAPGPSASFR | 0.000 | 0.000 | 0.000 | 0.033 | 0.000 | 0.000 | 0.397 | 0.571 | ||
| 1 spectrum, VSVSTAR | 0.000 | 0.000 | 0.000 | 0.198 | 0.000 | 0.000 | 0.325 | 0.477 | ||
| 2 spectra, AGLQEK | 0.000 | 0.000 | 0.000 | 0.130 | 0.126 | 0.336 | 0.409 | 0.000 | ||
| 1 spectrum, TSVPAPLNSCLLK | 0.138 | 0.000 | 0.047 | 0.000 | 0.000 | 0.123 | 0.540 | 0.152 | ||
| 2 spectra, NEAPEGNLGDFAEFQR | 0.000 | 0.000 | 0.049 | 0.000 | 0.000 | 0.271 | 0.407 | 0.273 | ||
| 11 spectra, AGLEEK | 0.000 | 0.000 | 0.112 | 0.602 | 0.000 | 0.127 | 0.160 | 0.000 | ||
| 1 spectrum, GYFTLR | 0.000 | 0.000 | 0.000 | 0.000 | 0.000 | 0.274 | 0.517 | 0.208 | ||
| 1 spectrum, IEAVEMHLTR | 0.000 | 0.000 | 0.089 | 0.000 | 0.000 | 0.415 | 0.429 | 0.067 |
| Plot | Lyso | Other | |||||||||||
| Expt C |
3 peptides |
6 spectra |
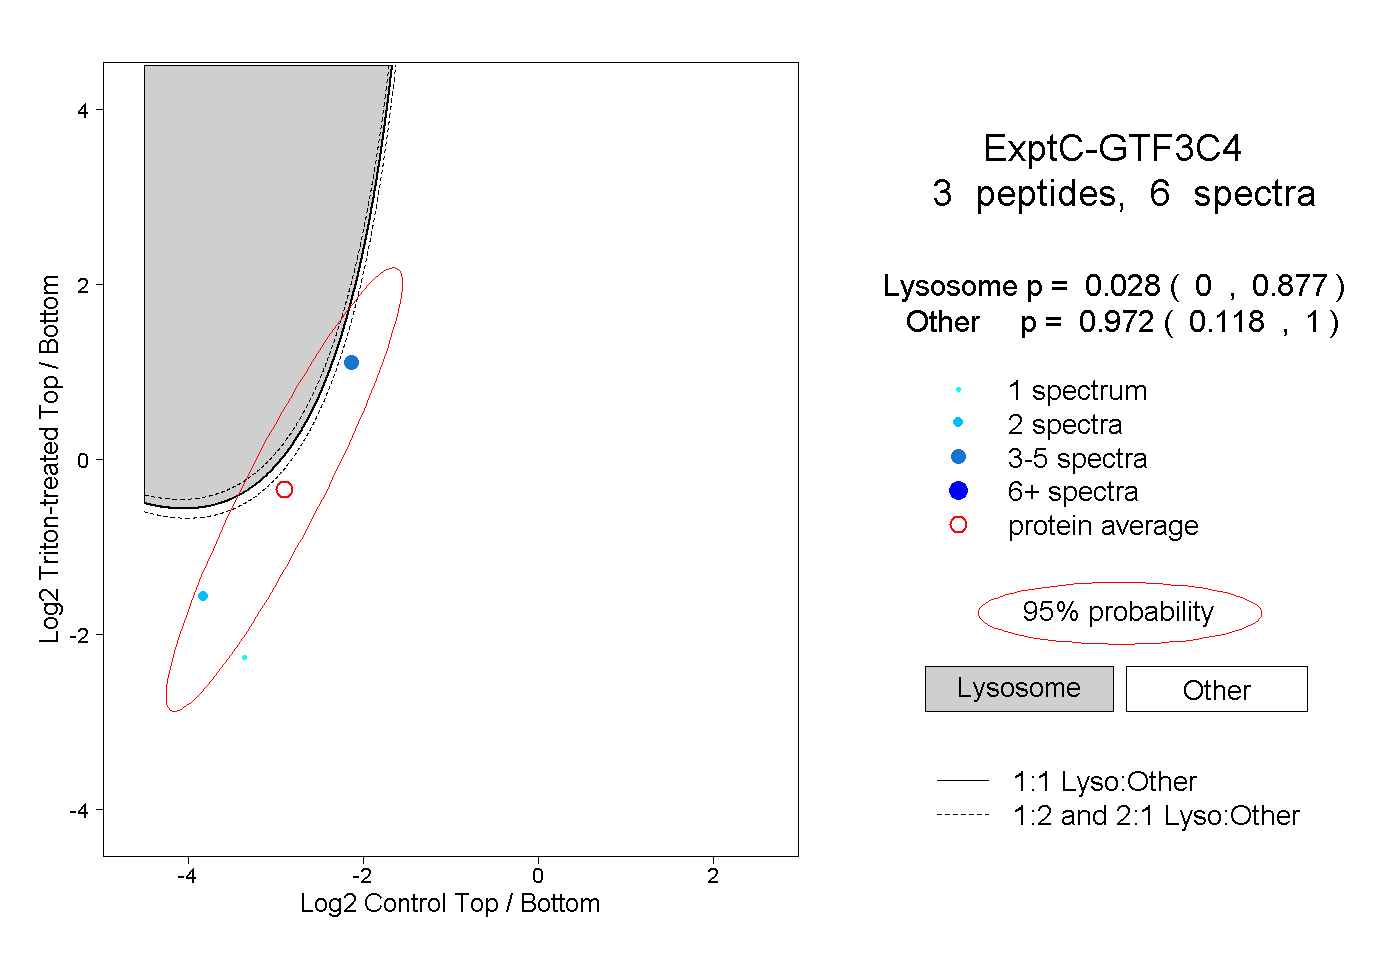 |
0.028 0.000 | 0.877 |
0.972 0.118 | 1.000 |