 5
5peptides
spectra
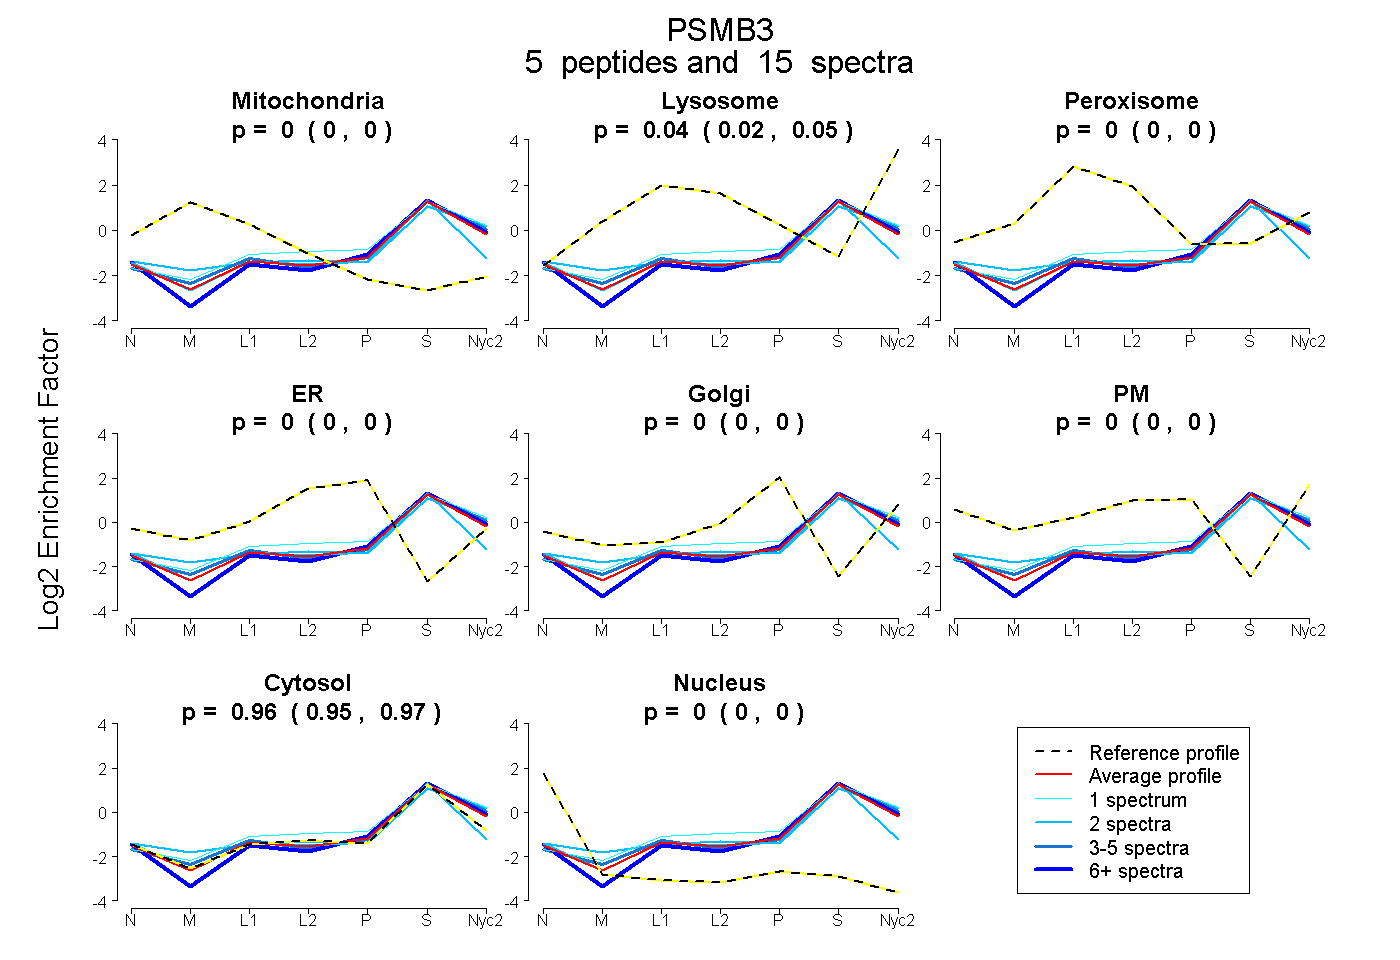
0.000 | 0.000
0.024 | 0.051
0.000 | 0.000
0.000 | 0.000
0.000 | 0.003
0.000 | 0.000
0.947 | 0.972
0.000 | 0.000
3peptides
spectra
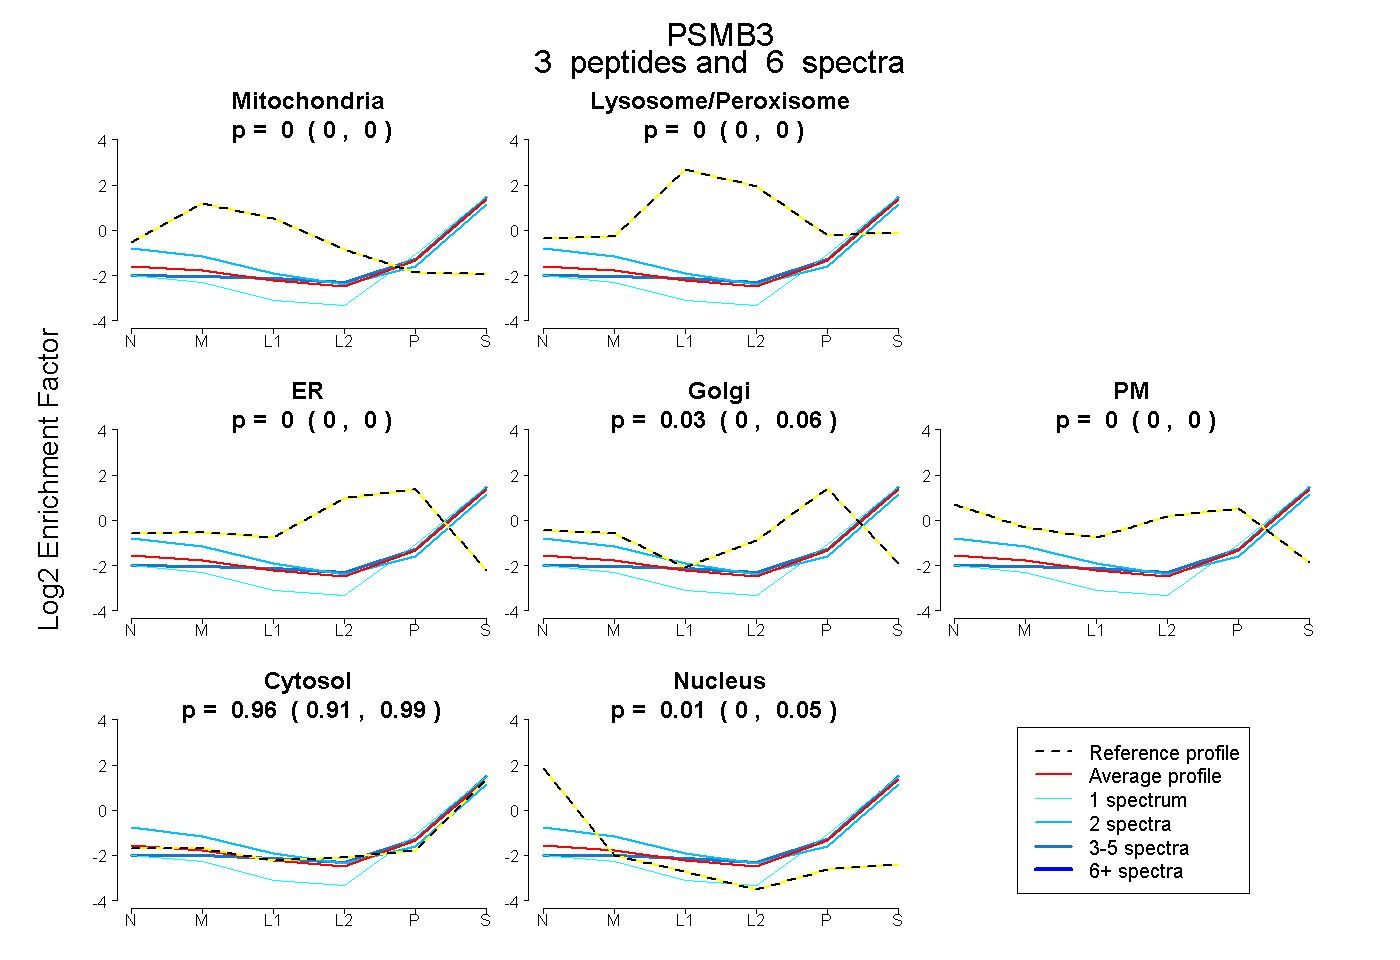
0.000 | 0.000
0.000 | 0.000
0.000 | 0.000
0.000 | 0.057
0.000 | 0.000
0.913 | 0.986
0.000 | 0.053
3peptides
spectra
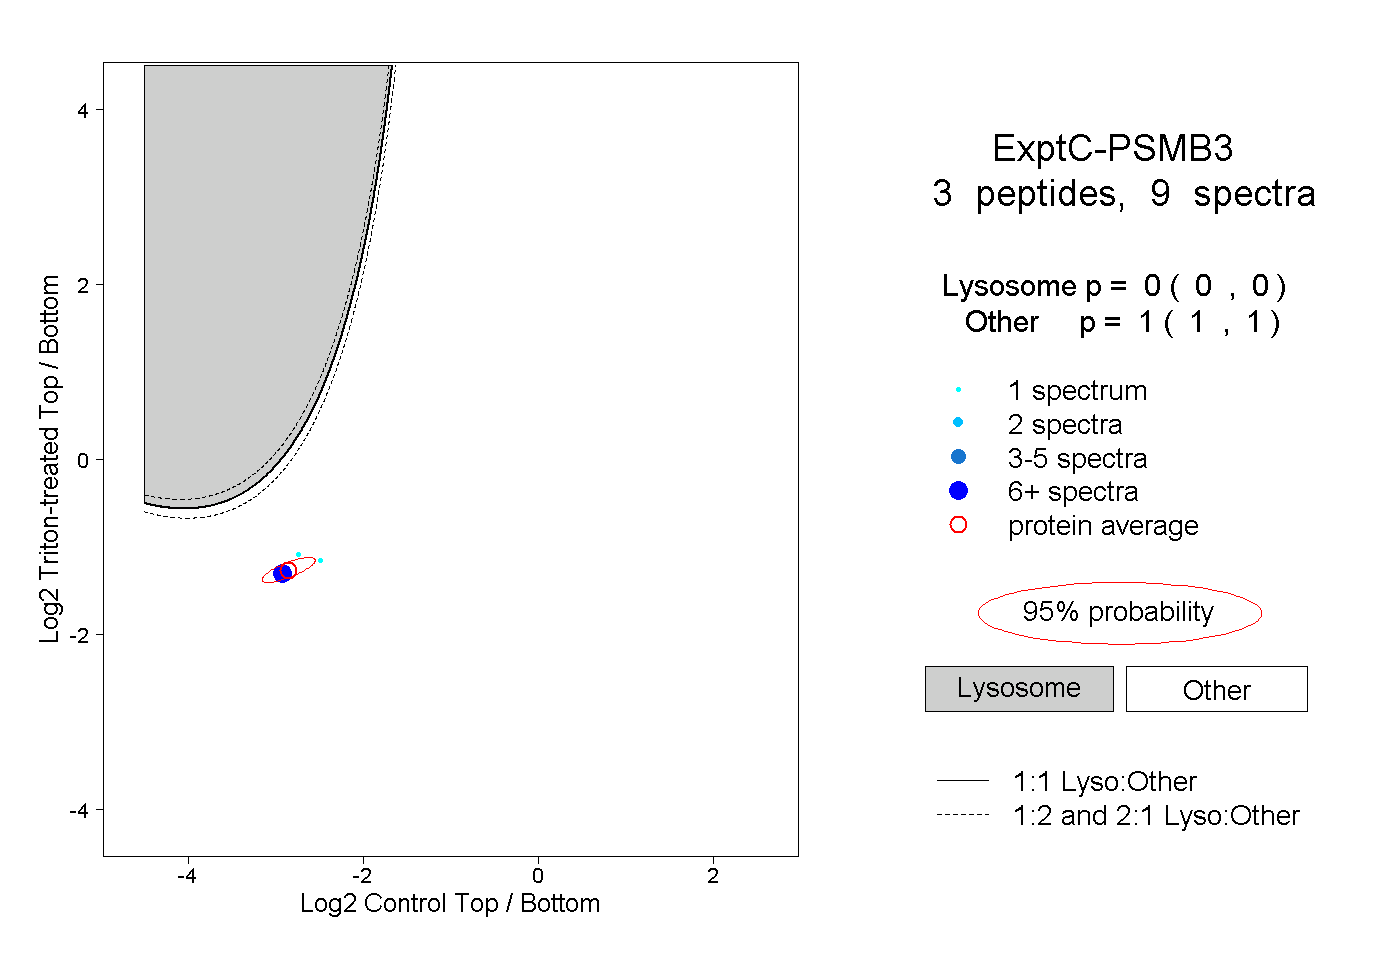
0.000 | 0.000
1.000 | 1.000
1peptide
spectrum
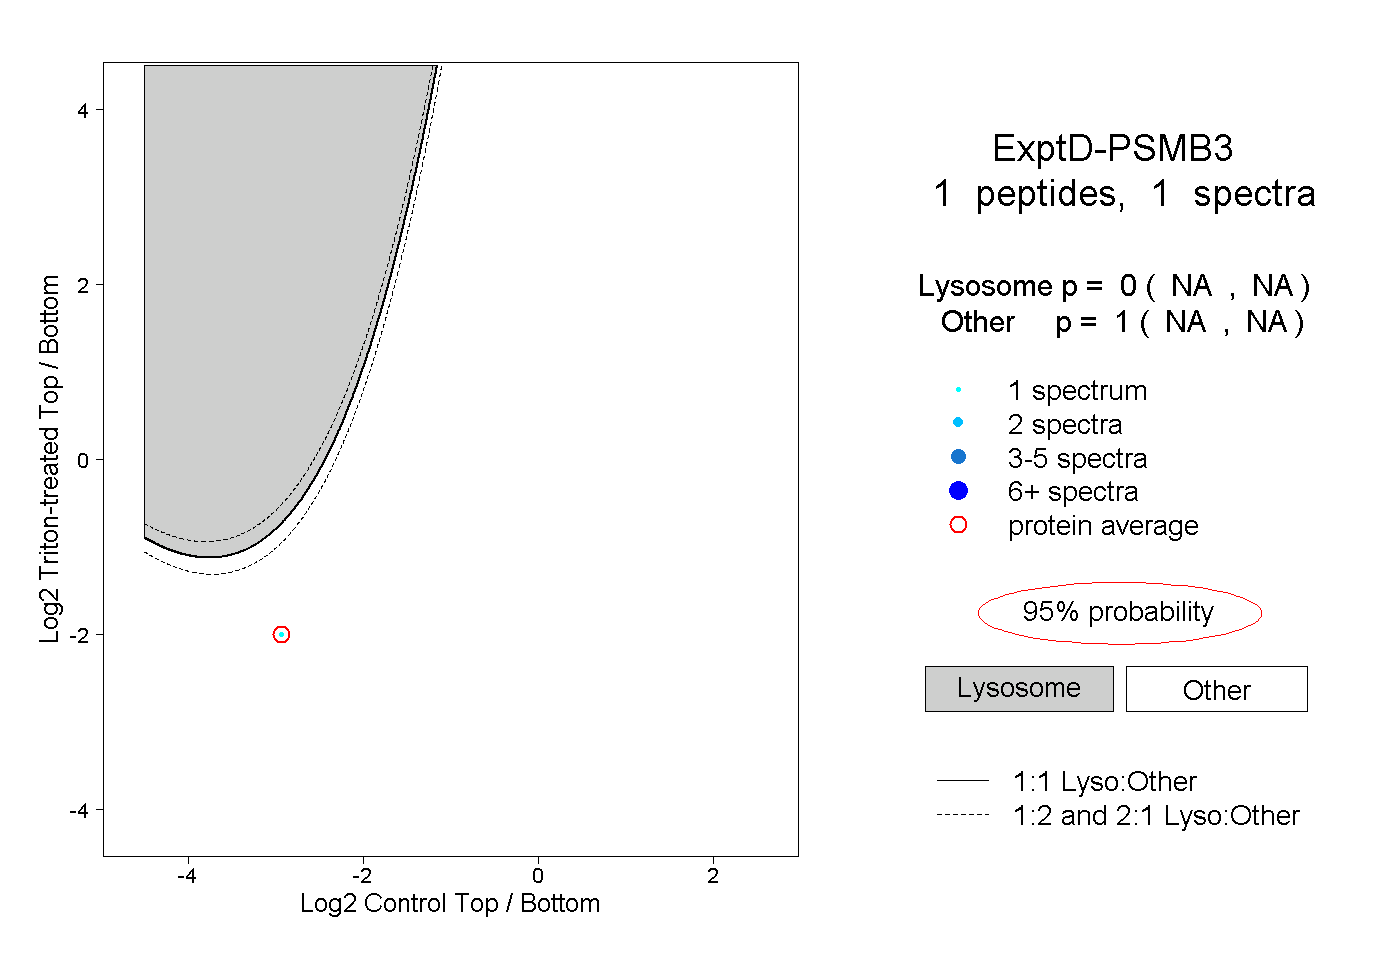
NA | NA
NA | NA