 5
5peptides
spectra
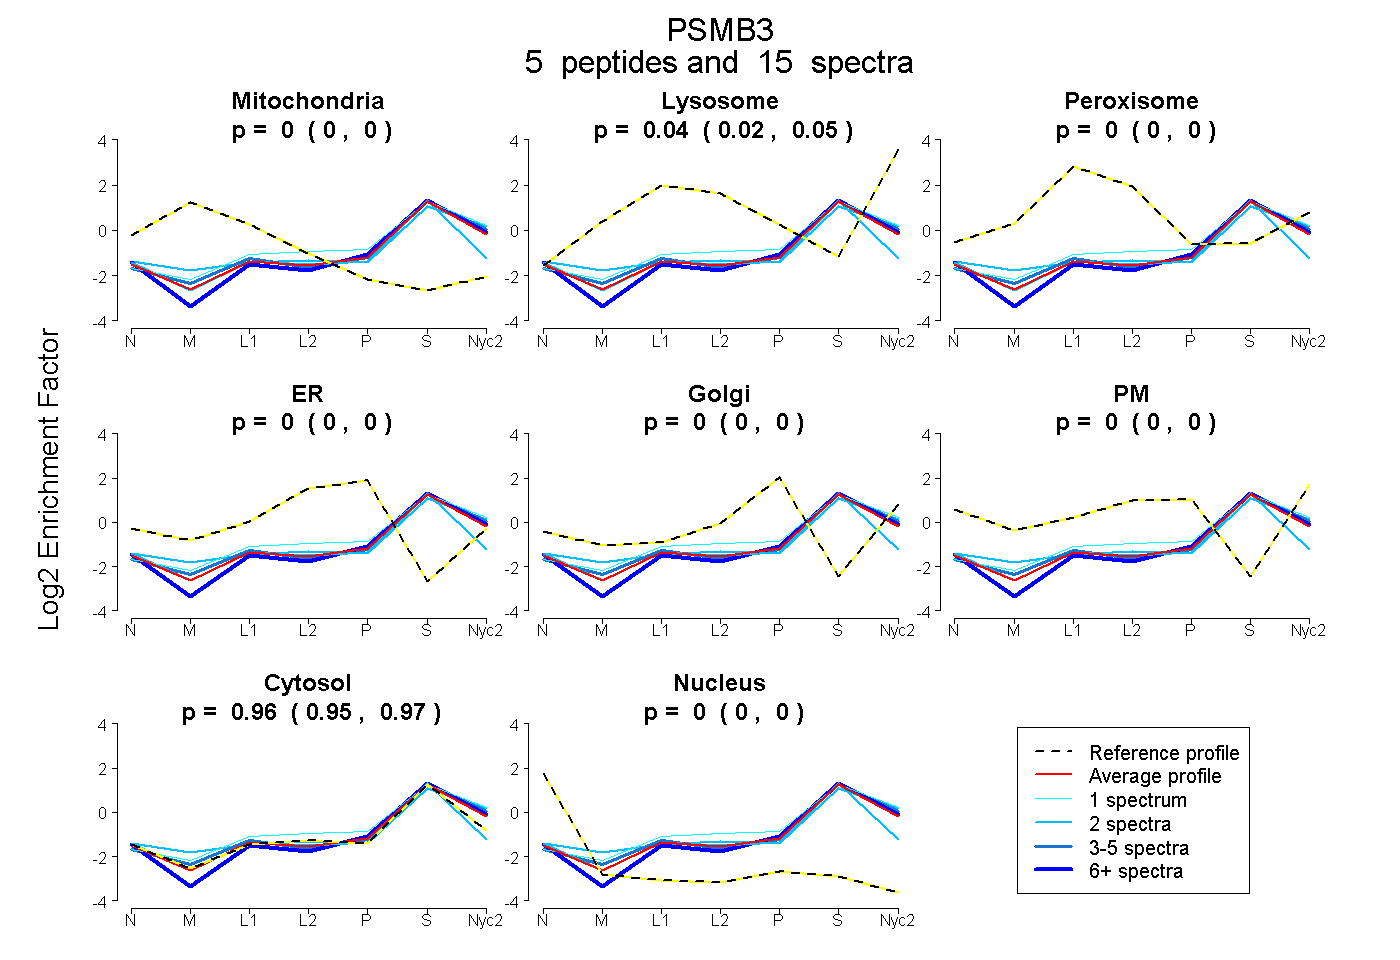
0.000 | 0.000
0.024 | 0.051
0.000 | 0.000
0.000 | 0.000
0.000 | 0.003
0.000 | 0.000
0.947 | 0.972
0.000 | 0.000
| Plot | Mito | Lyso | Perox | ER | Golgi | PM | Cytosol | Nucleus | |||||
| Expt A |
5 peptides |
15 spectra |
|
0.000 0.000 | 0.000 |
0.039 0.024 | 0.051 |
0.000 0.000 | 0.000 |
0.000 0.000 | 0.000 |
0.000 0.000 | 0.003 |
0.000 0.000 | 0.000 |
0.961 0.947 | 0.972 |
0.000 0.000 | 0.000 |
| 2 spectra, NCVAIAADR | 0.000 | 0.000 | 0.000 | 0.000 | 0.000 | 0.000 | 0.972 | 0.028 | ||
| 6 spectra, LNLYELK | 0.000 | 0.000 | 0.000 | 0.000 | 0.004 | 0.000 | 0.996 | 0.000 | ||
| 1 spectrum, SVMSYNGGAVMAMK | 0.000 | 0.154 | 0.000 | 0.000 | 0.000 | 0.000 | 0.846 | 0.000 | ||
| 4 spectra, IFPMGDR | 0.000 | 0.073 | 0.000 | 0.000 | 0.000 | 0.000 | 0.927 | 0.000 | ||
| 2 spectra, FGIQAQMVTTDFQK | 0.000 | 0.120 | 0.000 | 0.000 | 0.000 | 0.000 | 0.880 | 0.000 |
| Plot | Mito | Lyso or Perox | ER | Golgi | PM | Cytosol | Nucleus | ||||||
| Expt B |
3 peptides |
6 spectra |
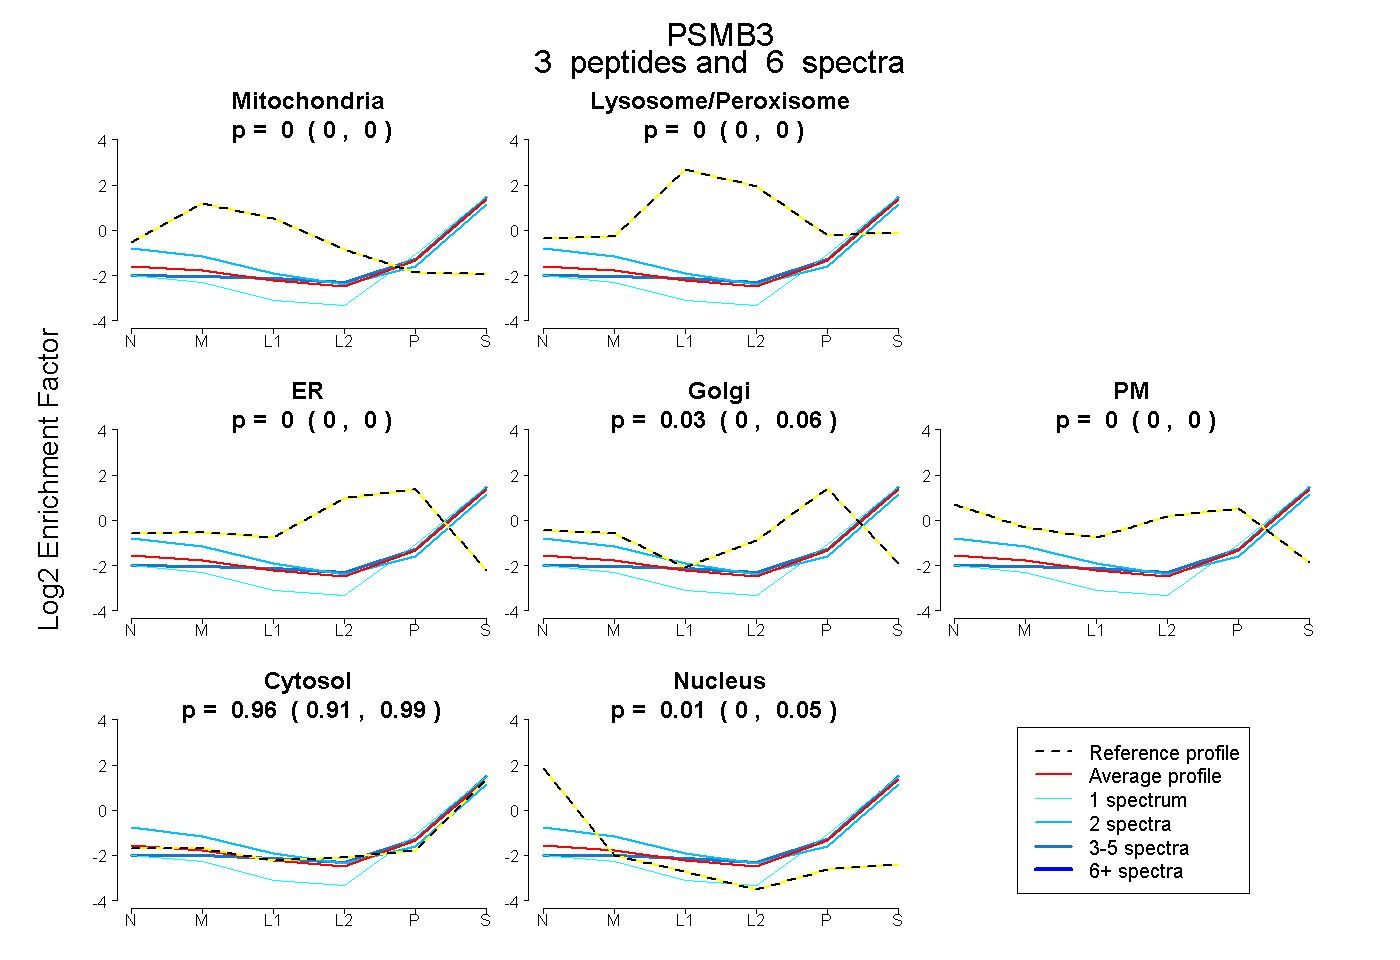 |
0.000 0.000 | 0.000 |
0.000 0.000 | 0.000 |
0.000 0.000 | 0.000 |
0.030 0.000 | 0.057 |
0.000 0.000 | 0.000 |
0.958 0.913 | 0.986 |
0.012 0.000 | 0.053 |
|||
| Plot | Lyso | Other | |||||||||||
| Expt C |
3 peptides |
9 spectra |
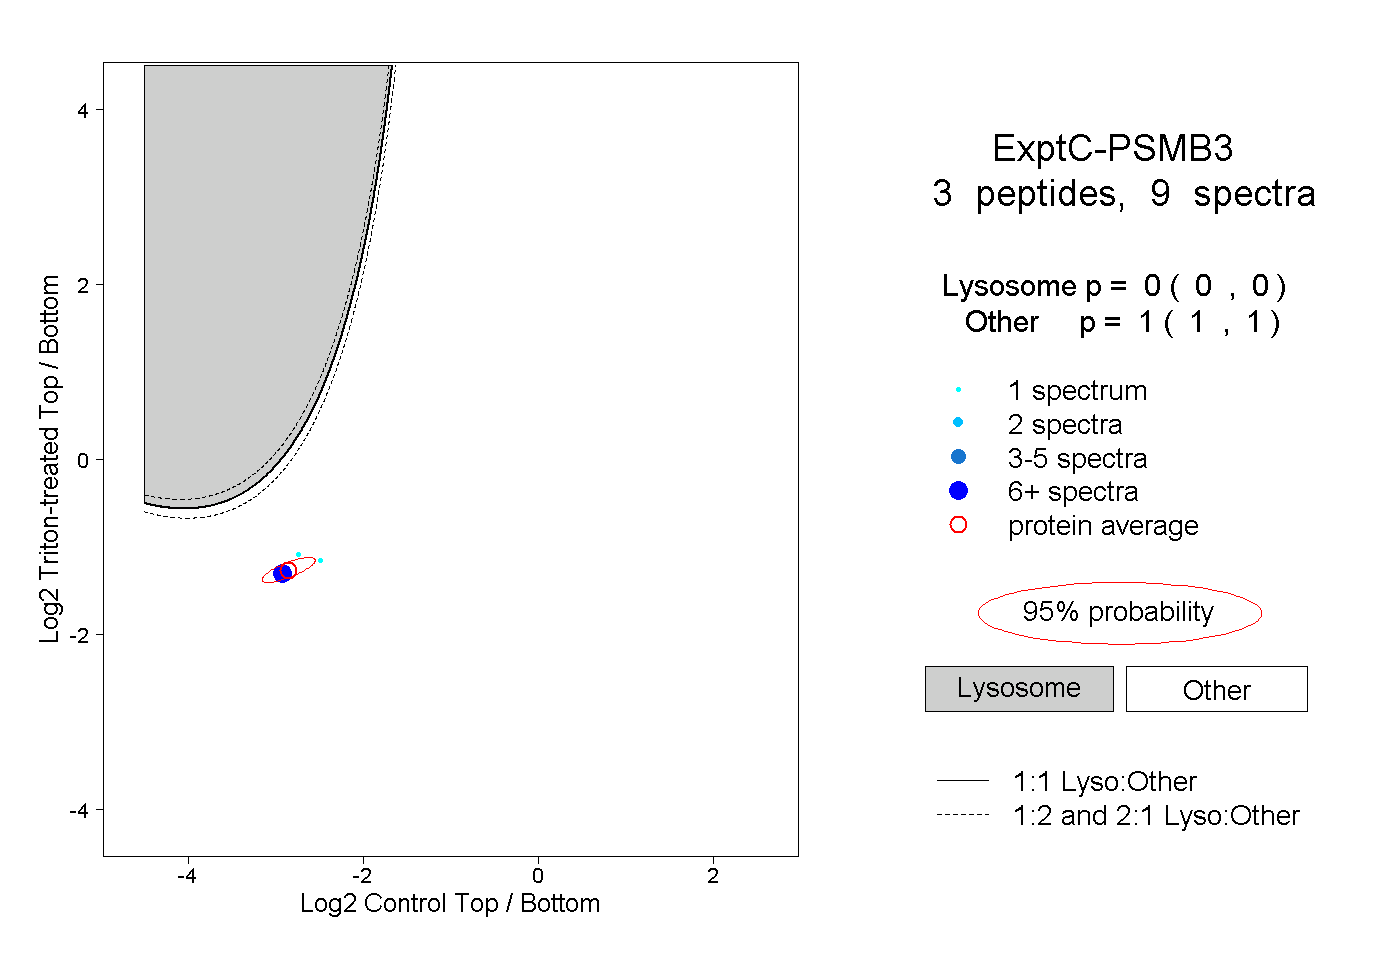 |
0.000 0.000 | 0.000 |
1.000 1.000 | 1.000 |
||||||||
| Plot | Lyso | Other | |||||||||||
| Expt D |
1 peptide |
1 spectrum |
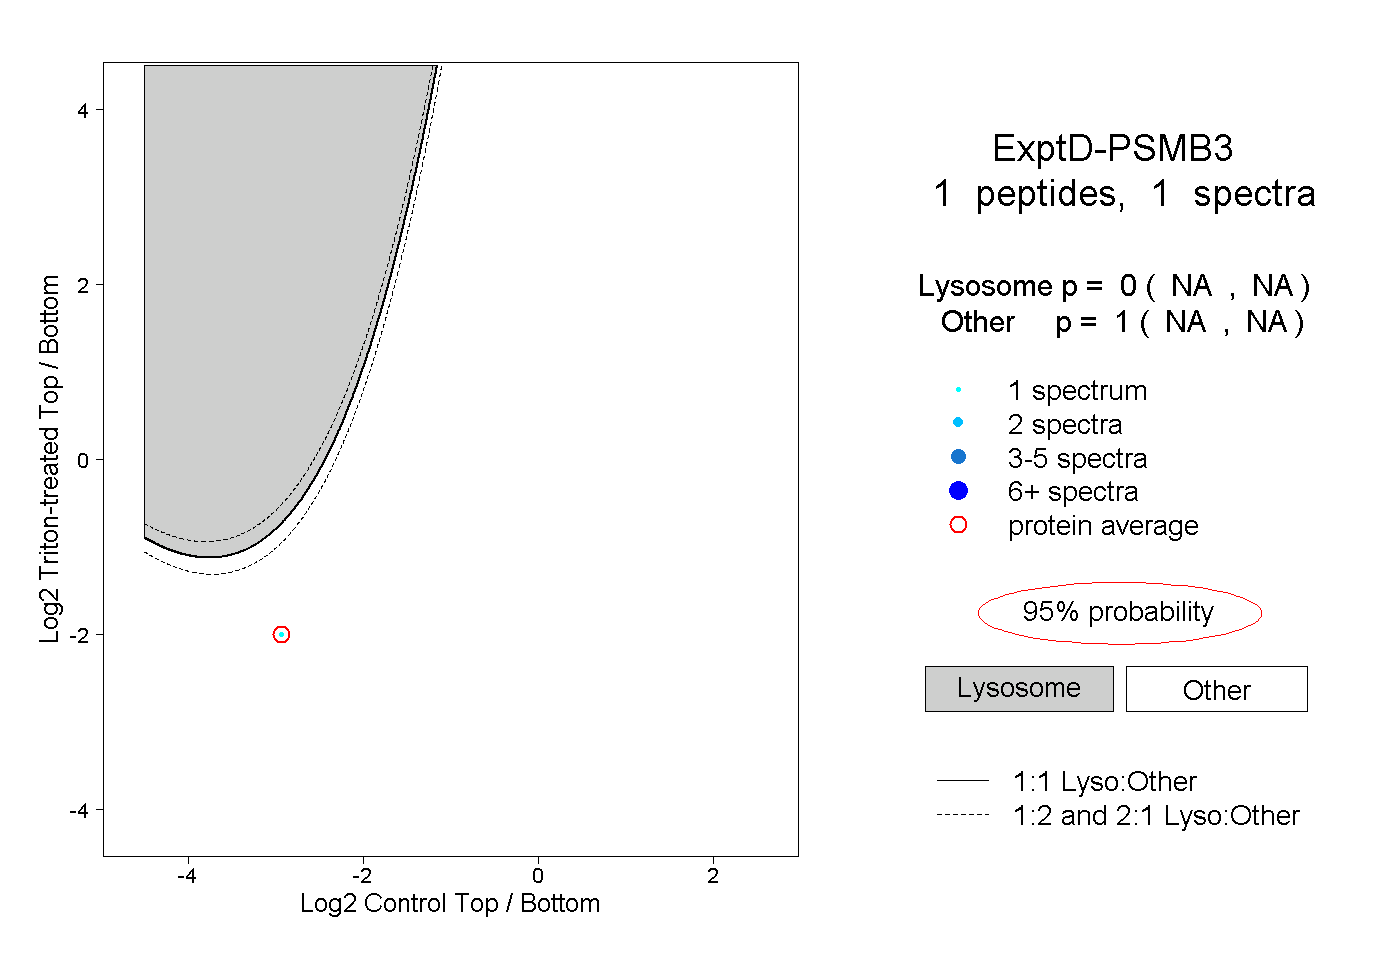 |
0.000 NA | NA |
1.000 NA | NA |