 6
6peptides
spectra
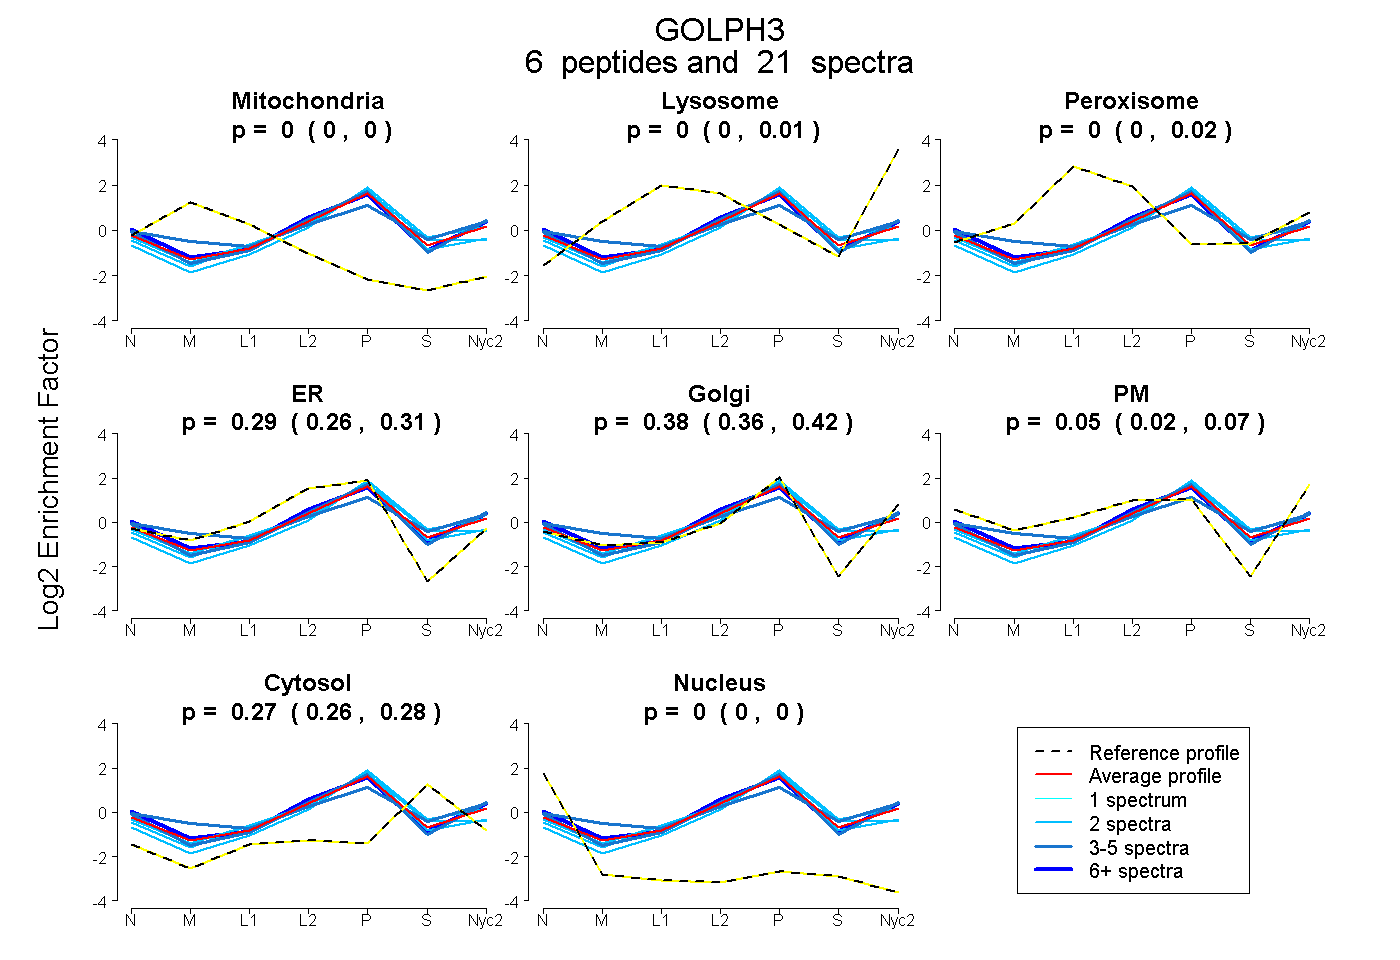
0.000 | 0.000
0.000 | 0.010
0.000 | 0.016
0.263 | 0.313
0.357 | 0.416
0.015 | 0.072
0.259 | 0.280
0.000 | 0.000
3peptides
spectra
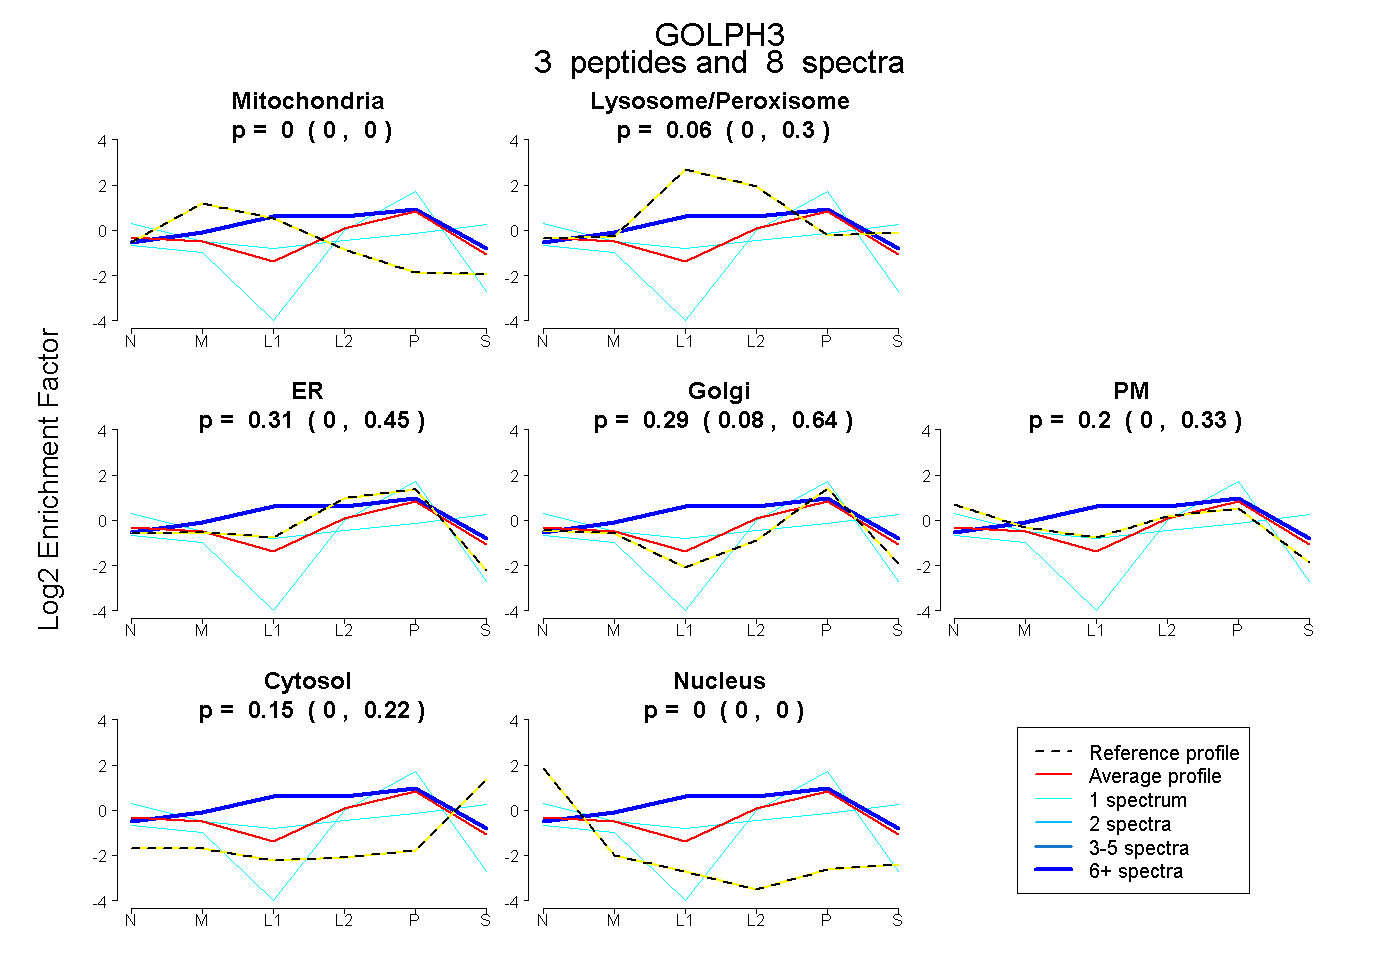
0.000 | 0.003
0.000 | 0.301
0.000 | 0.452
0.082 | 0.639
0.000 | 0.329
0.004 | 0.221
0.000 | 0.001
10peptides
spectra
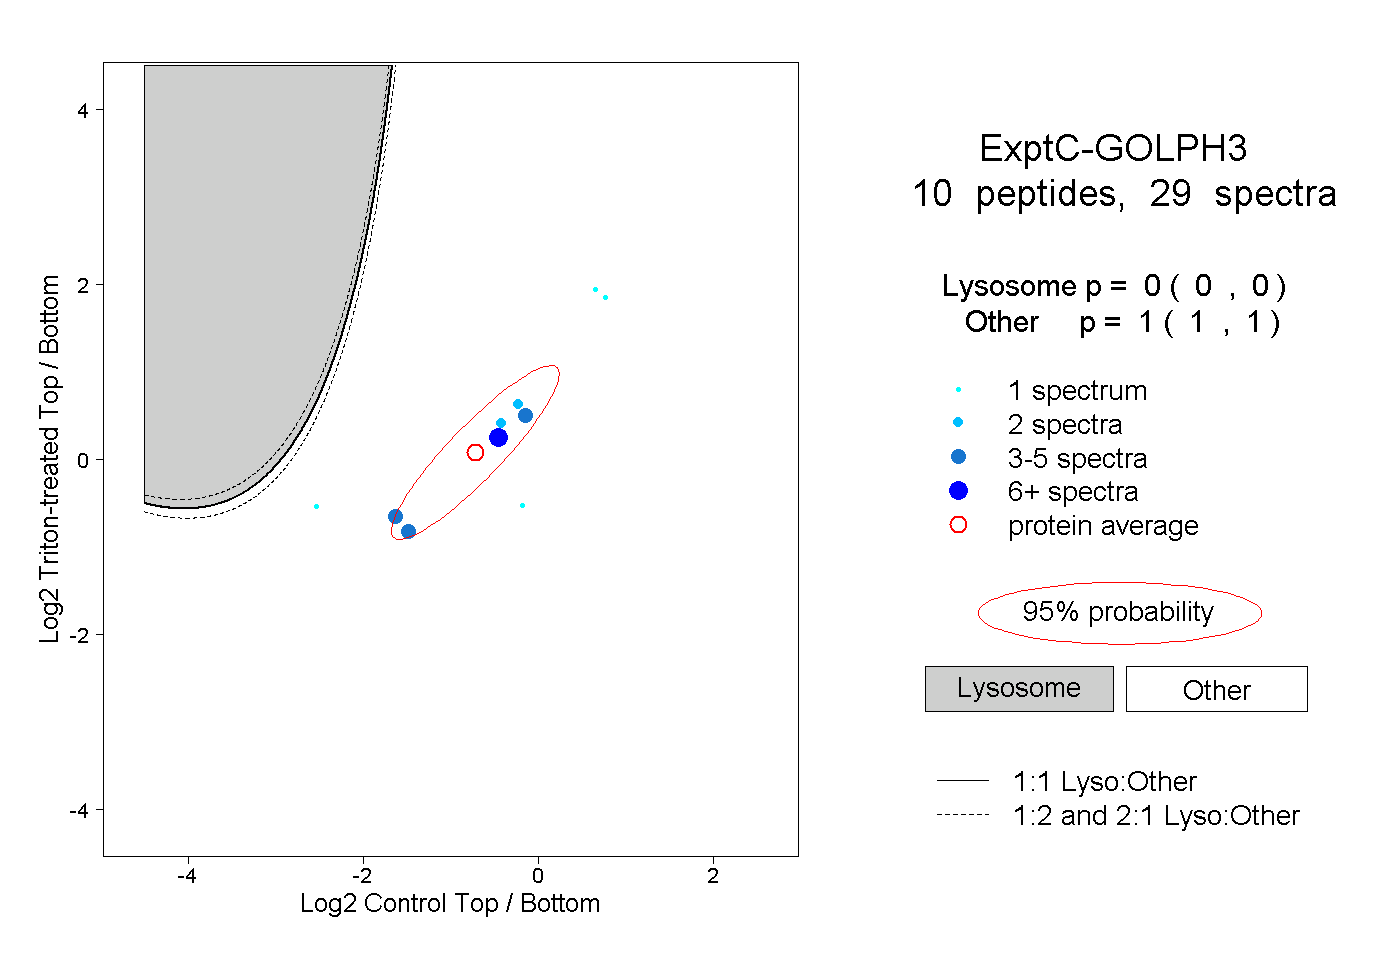
0.000 | 0.000
1.000 | 1.000
2peptides
spectra
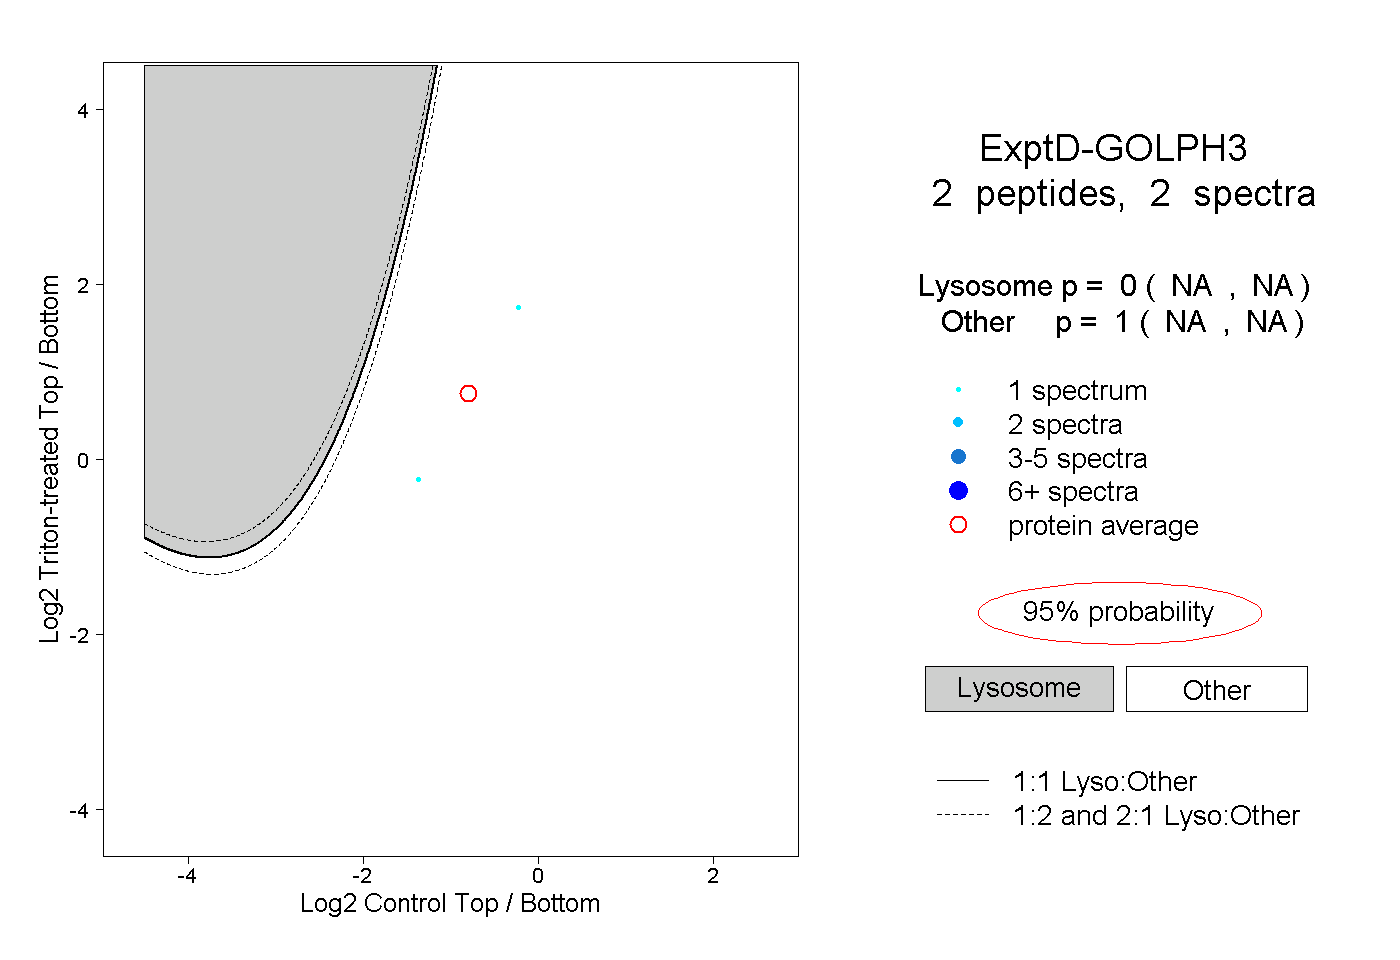
NA | NA
NA | NA