 6
6peptides
spectra
0.000 | 0.000
0.000 | 0.010
0.000 | 0.016
0.263 | 0.313
0.357 | 0.416
0.015 | 0.072
0.259 | 0.280
0.000 | 0.000
| Plot | Mito | Lyso | Perox | ER | Golgi | PM | Cytosol | Nucleus | |||||
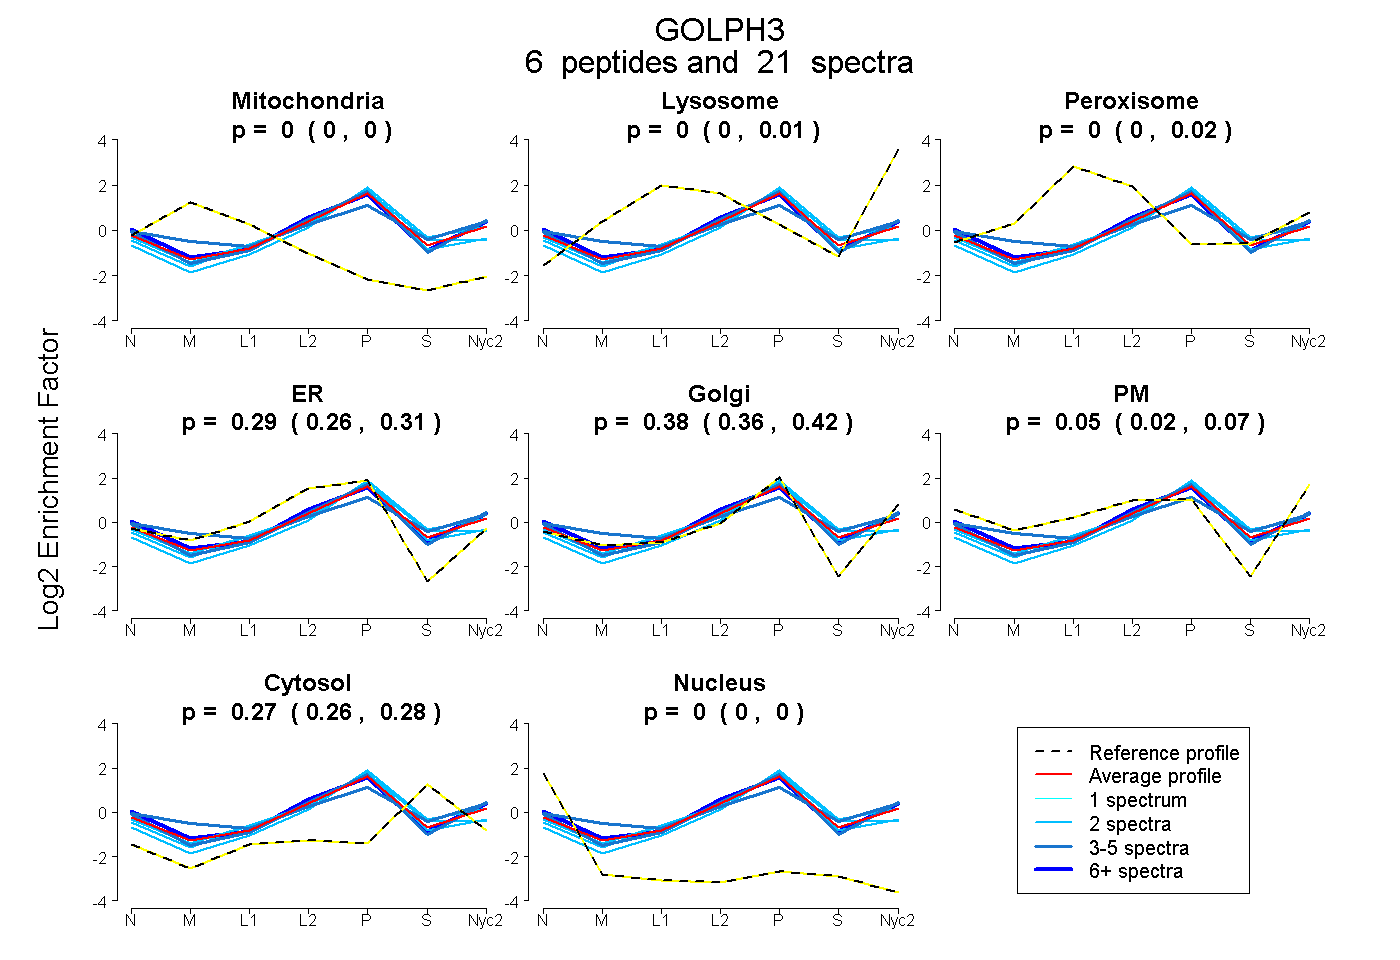
| Expt A |
6 peptides |
21 spectra |
|
0.000 0.000 | 0.000 |
0.000 0.000 | 0.010 |
0.002 0.000 | 0.016 |
0.292 0.263 | 0.313 |
0.382 0.357 | 0.416 |
0.053 0.015 | 0.072 |
0.271 0.259 | 0.280 |
0.000 0.000 | 0.000 |
| 4 spectra, SDAPTGDVLLDEALK | 0.000 | 0.000 | 0.000 | 0.214 | 0.480 | 0.089 | 0.218 | 0.000 | ||
| 2 spectra, QLLDLDPEVECLK | 0.000 | 0.000 | 0.000 | 0.436 | 0.290 | 0.000 | 0.275 | 0.000 | ||
| 7 spectra, LHYQLR | 0.000 | 0.000 | 0.000 | 0.250 | 0.331 | 0.188 | 0.230 | 0.000 | ||
| 2 spectra, GCMLIELALR | 0.000 | 0.000 | 0.000 | 0.446 | 0.215 | 0.000 | 0.339 | 0.000 | ||
| 2 spectra, LTLMEEVLLLGLK | 0.000 | 0.000 | 0.000 | 0.131 | 0.541 | 0.000 | 0.329 | 0.000 | ||
| 4 spectra, WVNDPHR | 0.000 | 0.000 | 0.096 | 0.053 | 0.333 | 0.238 | 0.281 | 0.000 |
| Plot | Mito | Lyso or Perox | ER | Golgi | PM | Cytosol | Nucleus | ||||||
| Expt B |
3 peptides |
8 spectra |
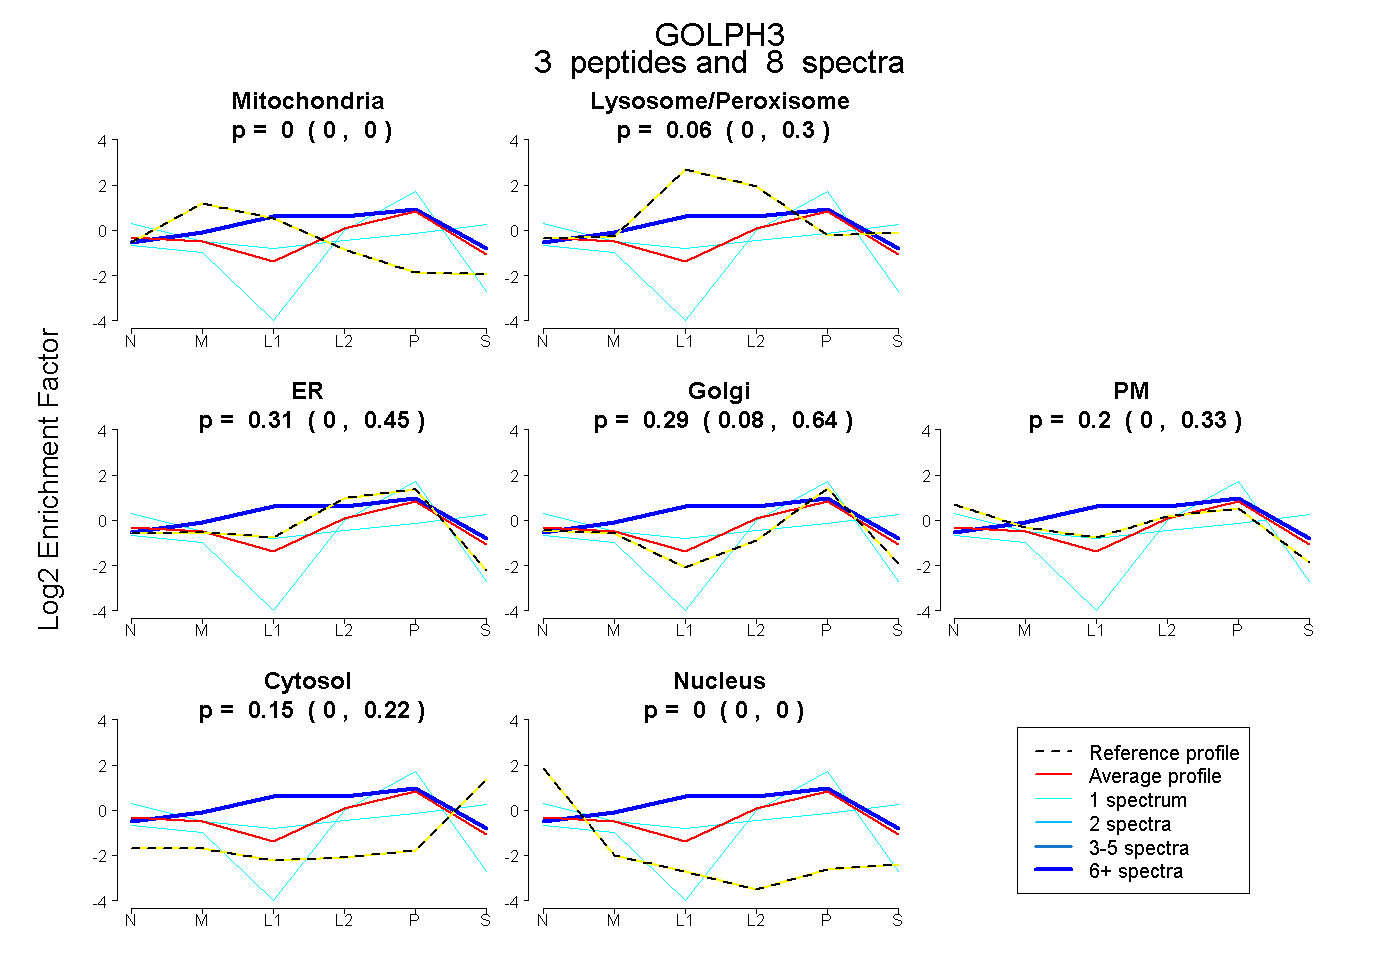 |
0.000 0.000 | 0.003 |
0.058 0.000 | 0.301 |
0.306 0.000 | 0.452 |
0.291 0.082 | 0.639 |
0.198 0.000 | 0.329 |
0.147 0.004 | 0.221 |
0.000 0.000 | 0.001 |
|||
| Plot | Lyso | Other | |||||||||||
| Expt C |
10 peptides |
29 spectra |
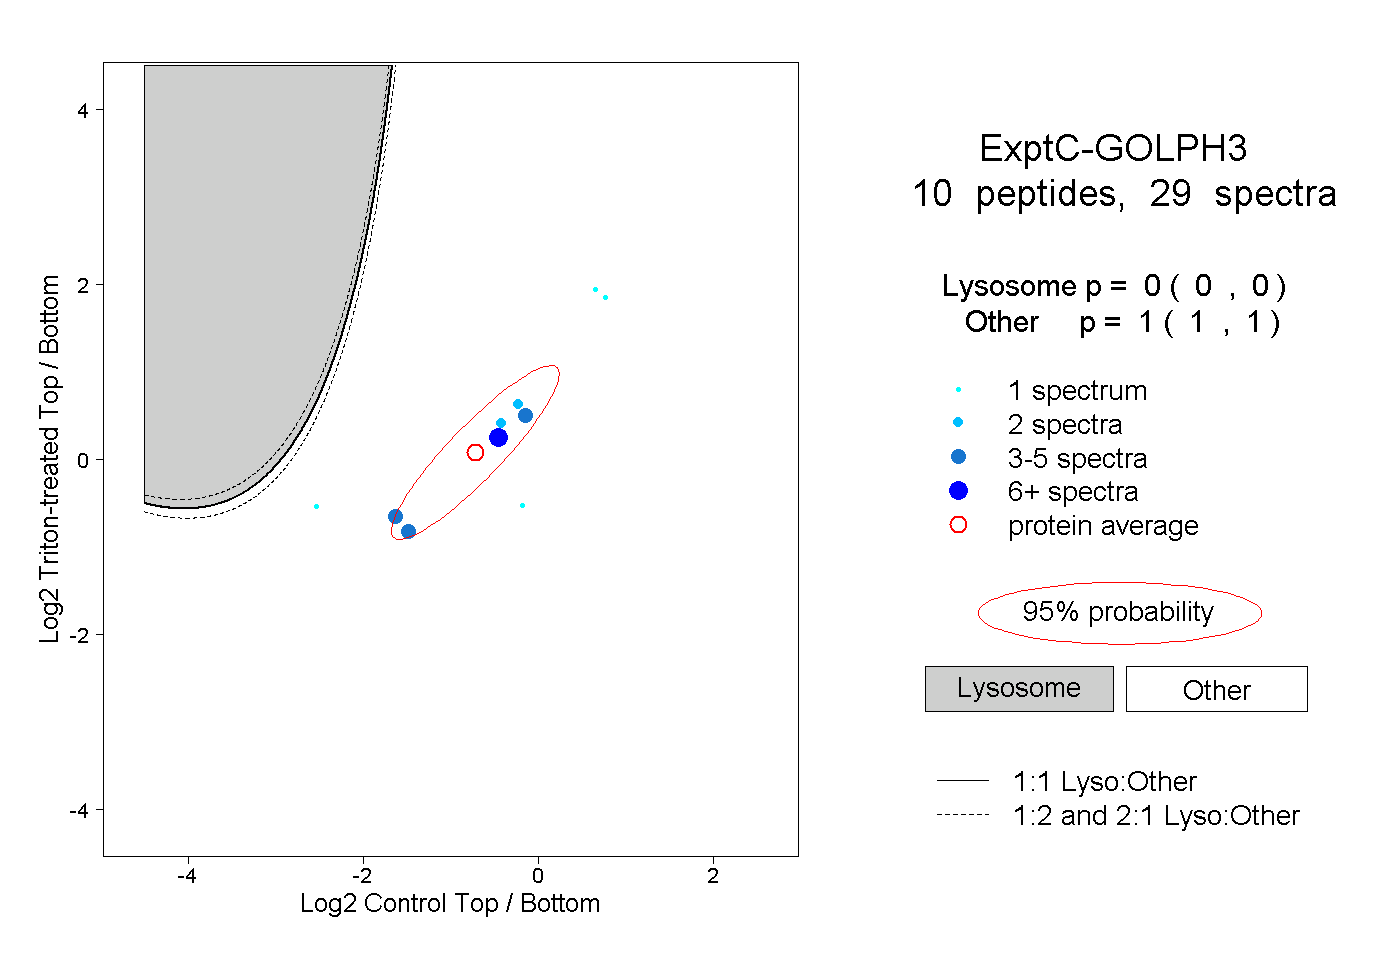 |
0.000 0.000 | 0.000 |
1.000 1.000 | 1.000 |
||||||||
| Plot | Lyso | Other | |||||||||||
| Expt D |
2 peptides |
2 spectra |
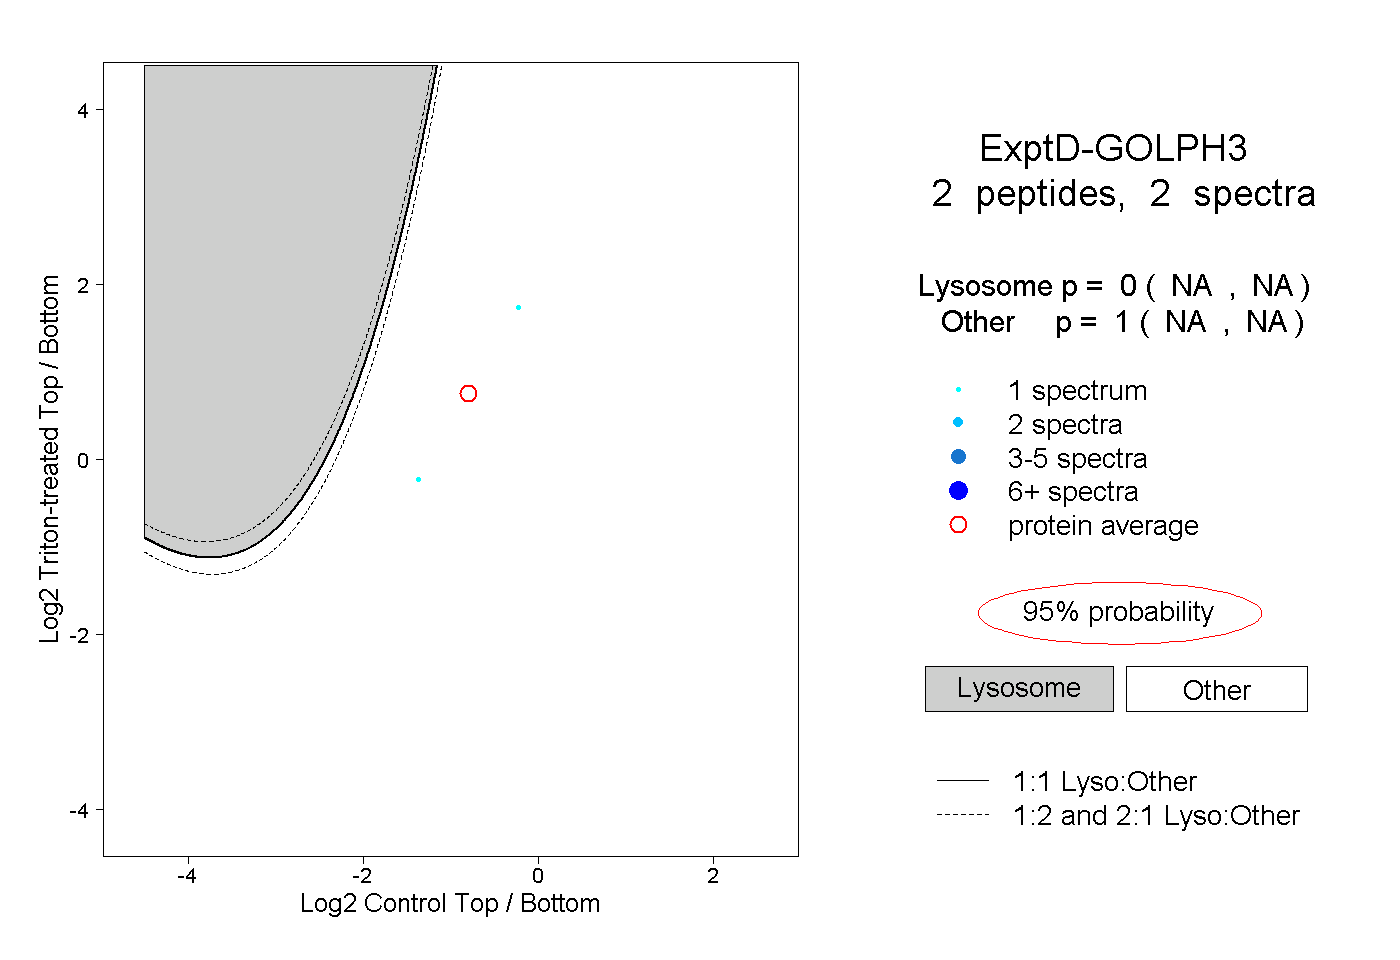 |
0.000 NA | NA |
1.000 NA | NA |