 4
4peptides
spectra
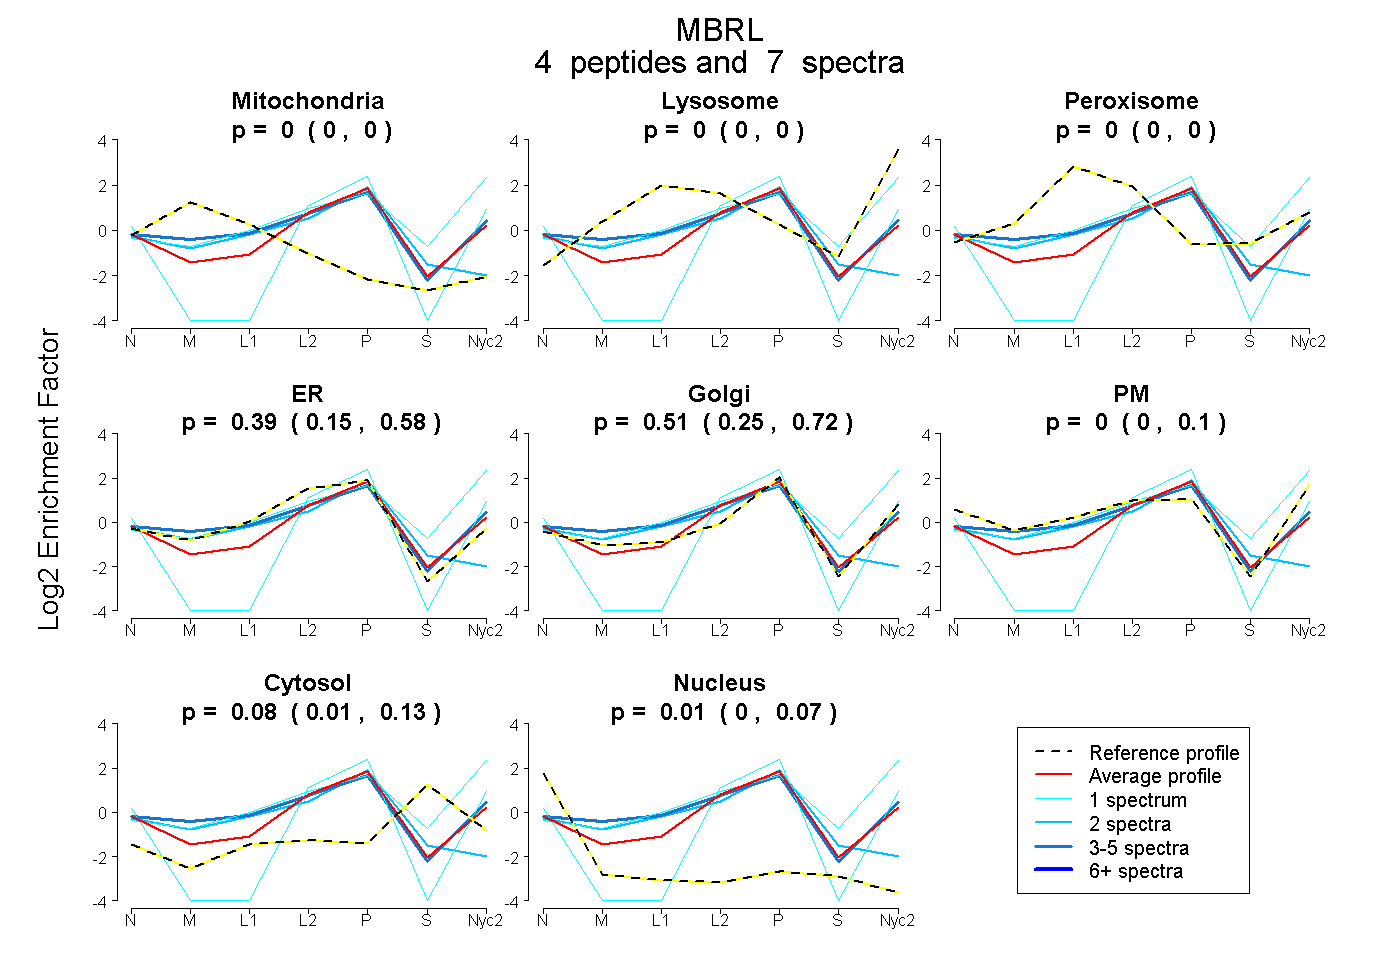
0.000 | 0.000
0.000 | 0.000
0.000 | 0.000
0.147 | 0.577
0.245 | 0.715
0.000 | 0.099
0.013 | 0.134
0.000 | 0.071
1peptide
spectrum
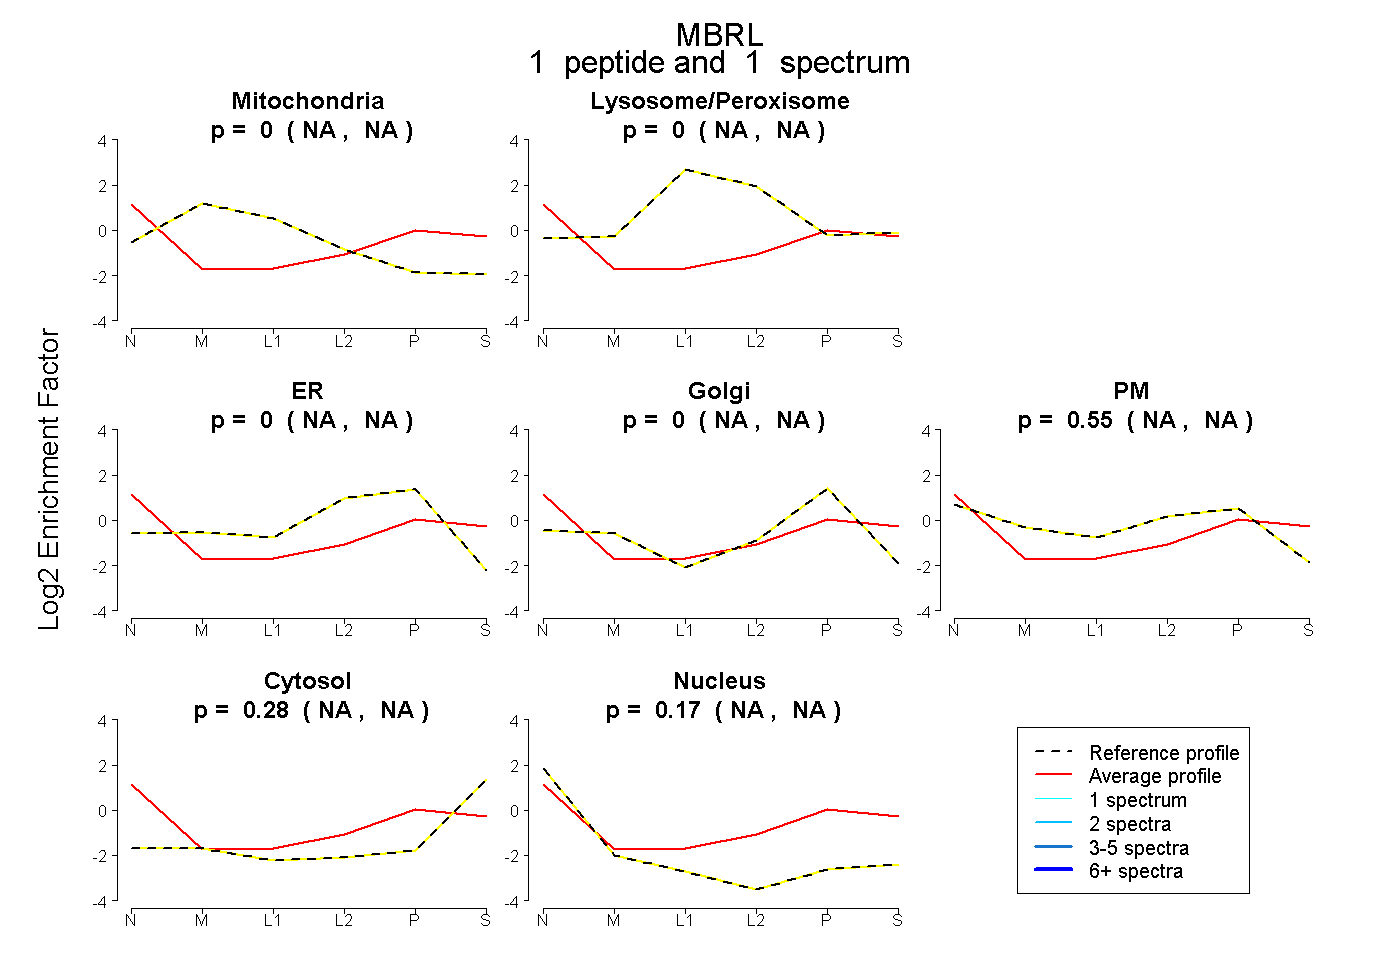
NA | NA
NA | NA
NA | NA
NA | NA
NA | NA
NA | NA
NA | NA
2peptides
spectra
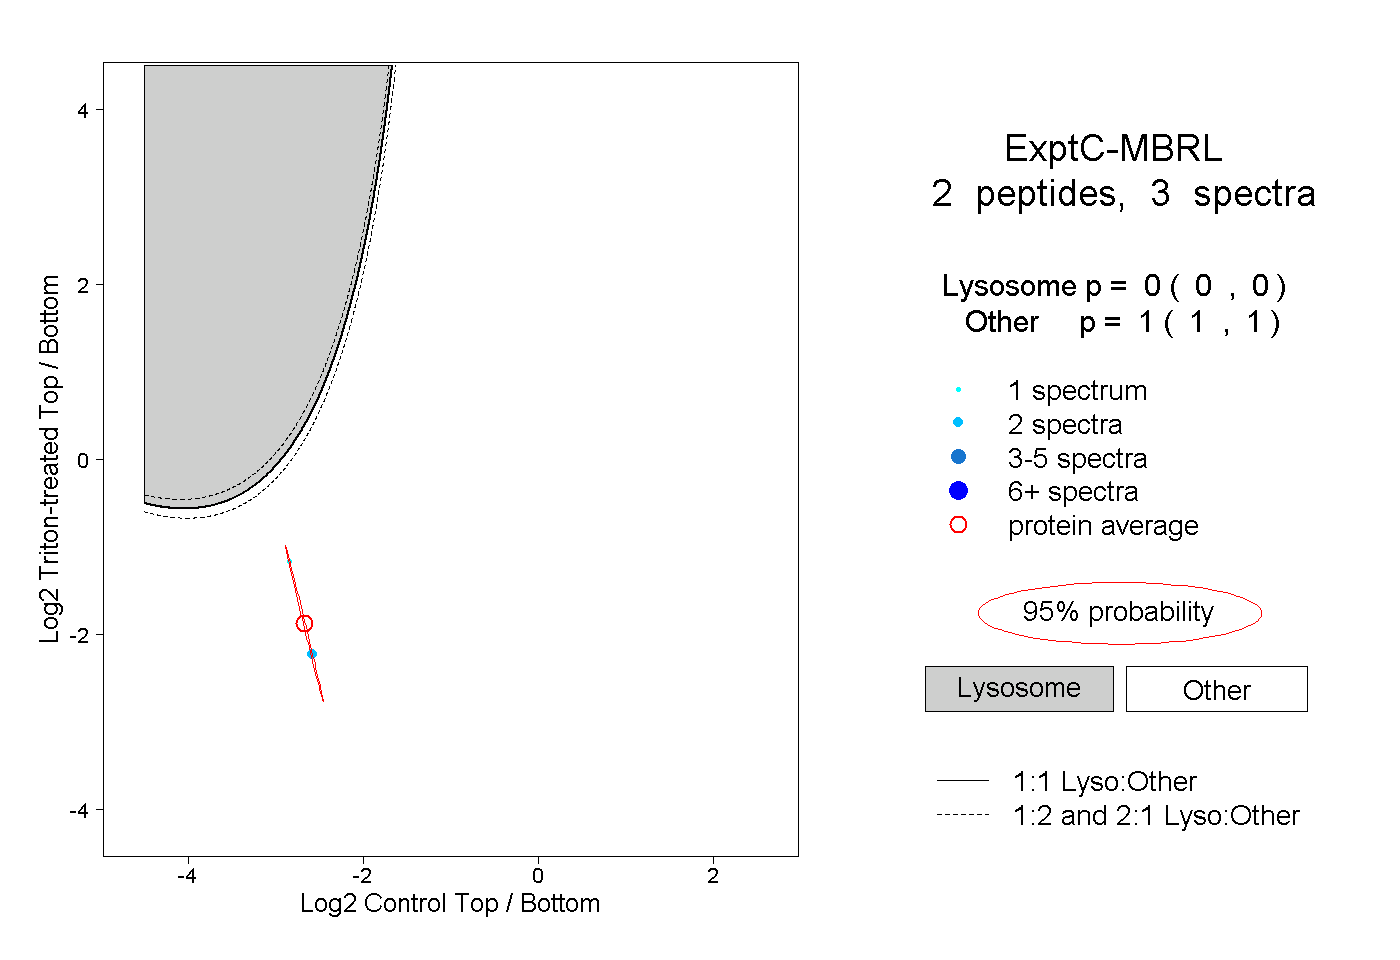
0.000 | 0.000
1.000 | 1.000
1peptide
spectrum

NA | NA
NA | NA