 4
4peptides
spectra
0.000 | 0.000
0.000 | 0.000
0.000 | 0.000
0.147 | 0.577
0.245 | 0.715
0.000 | 0.099
0.013 | 0.134
0.000 | 0.071
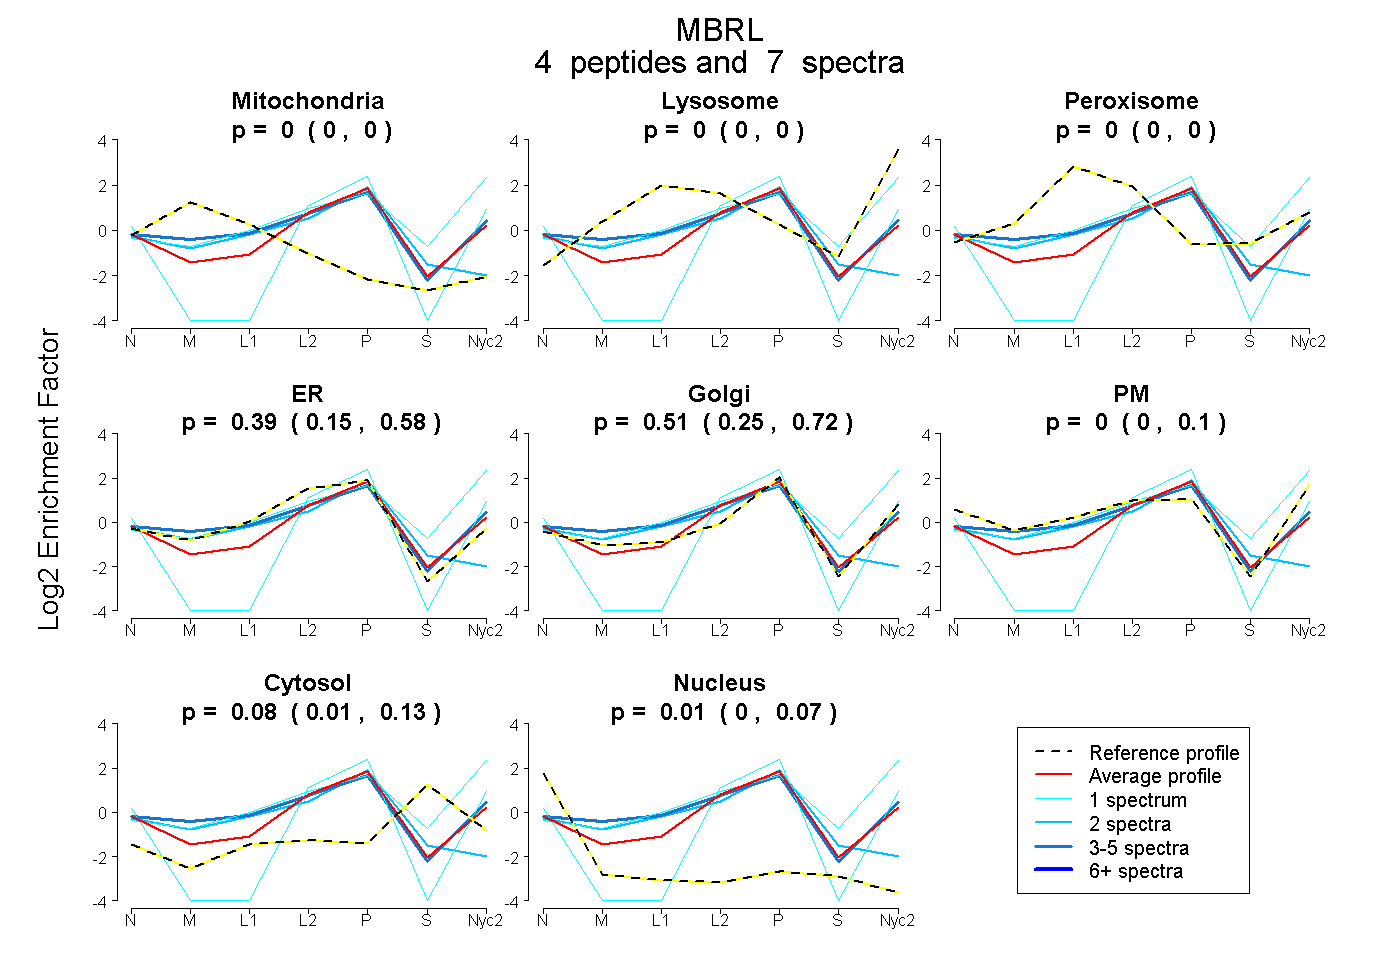
| Plot | Mito | Lyso | Perox | ER | Golgi | PM | Cytosol | Nucleus | |||||
| Expt A |
4 peptides |
7 spectra |
|
0.000 0.000 | 0.000 |
0.000 0.000 | 0.000 |
0.000 0.000 | 0.000 |
0.389 0.147 | 0.577 |
0.514 0.245 | 0.715 |
0.000 0.000 | 0.099 |
0.084 0.013 | 0.134 |
0.013 0.000 | 0.071 |
| 2 spectra, GPNLNPNPLINVR | 0.035 | 0.000 | 0.000 | 0.754 | 0.000 | 0.000 | 0.139 | 0.072 | ||
| 1 spectrum, SPINCLEHVR | 0.000 | 0.405 | 0.000 | 0.000 | 0.425 | 0.098 | 0.072 | 0.000 | ||
| 3 spectra, MAVTYSR | 0.031 | 0.000 | 0.087 | 0.332 | 0.426 | 0.124 | 0.000 | 0.000 | ||
| 1 spectrum, SEHAAAPGPGPNGGGGGGAAPVR | 0.000 | 0.000 | 0.000 | 0.000 | 0.871 | 0.000 | 0.000 | 0.129 |
| Plot | Mito | Lyso or Perox | ER | Golgi | PM | Cytosol | Nucleus | ||||||
| Expt B |
1 peptide |
1 spectrum |
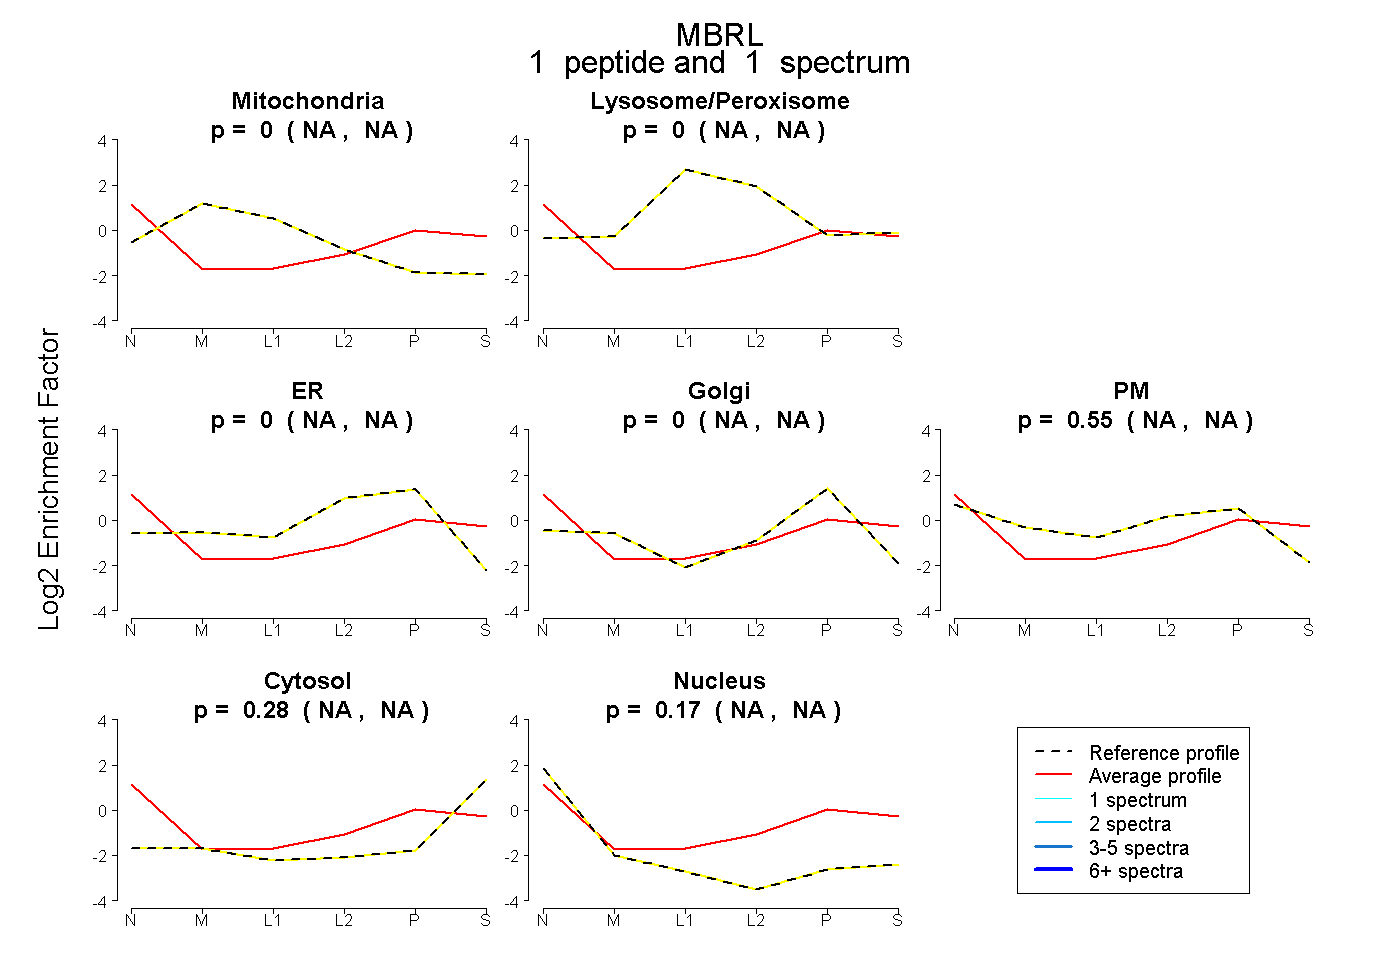 |
0.000 NA | NA |
0.000 NA | NA |
0.000 NA | NA |
0.000 NA | NA |
0.548 NA | NA |
0.278 NA | NA |
0.174 NA | NA |
|||
| Plot | Lyso | Other | |||||||||||
| Expt C |
2 peptides |
3 spectra |
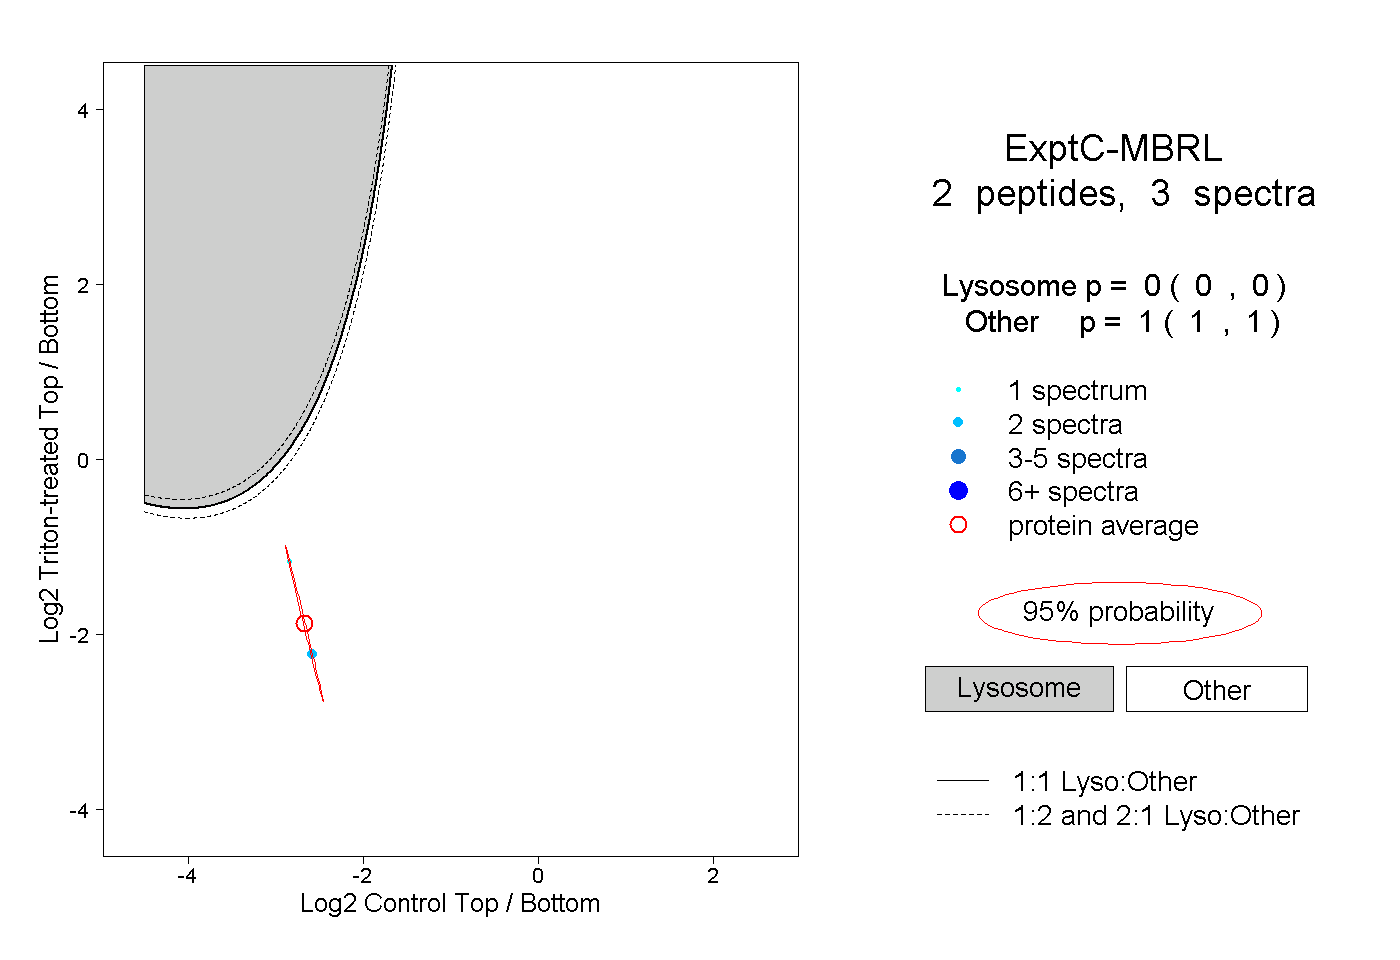 |
0.000 0.000 | 0.000 |
1.000 1.000 | 1.000 |
||||||||
| Plot | Lyso | Other | |||||||||||
| Expt D |
1 peptide |
1 spectrum |
 |
0.001 NA | NA |
0.999 NA | NA |