 6
6peptides
spectra
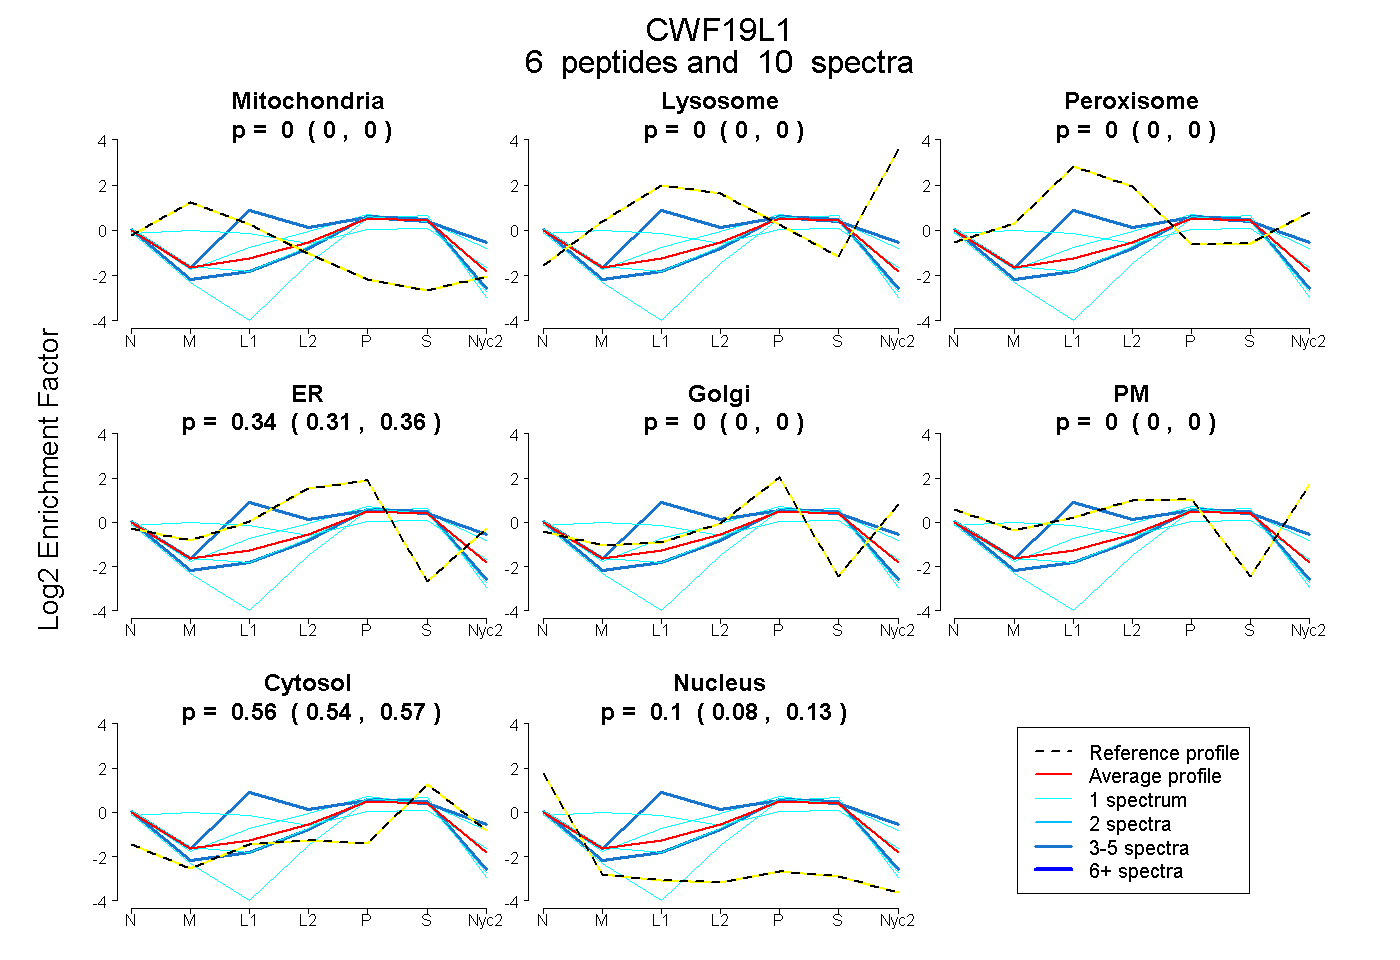
0.000 | 0.000
0.000 | 0.000
0.000 | 0.000
0.310 | 0.358
0.000 | 0.000
0.000 | 0.000
0.540 | 0.570
0.076 | 0.129
2peptides
spectra
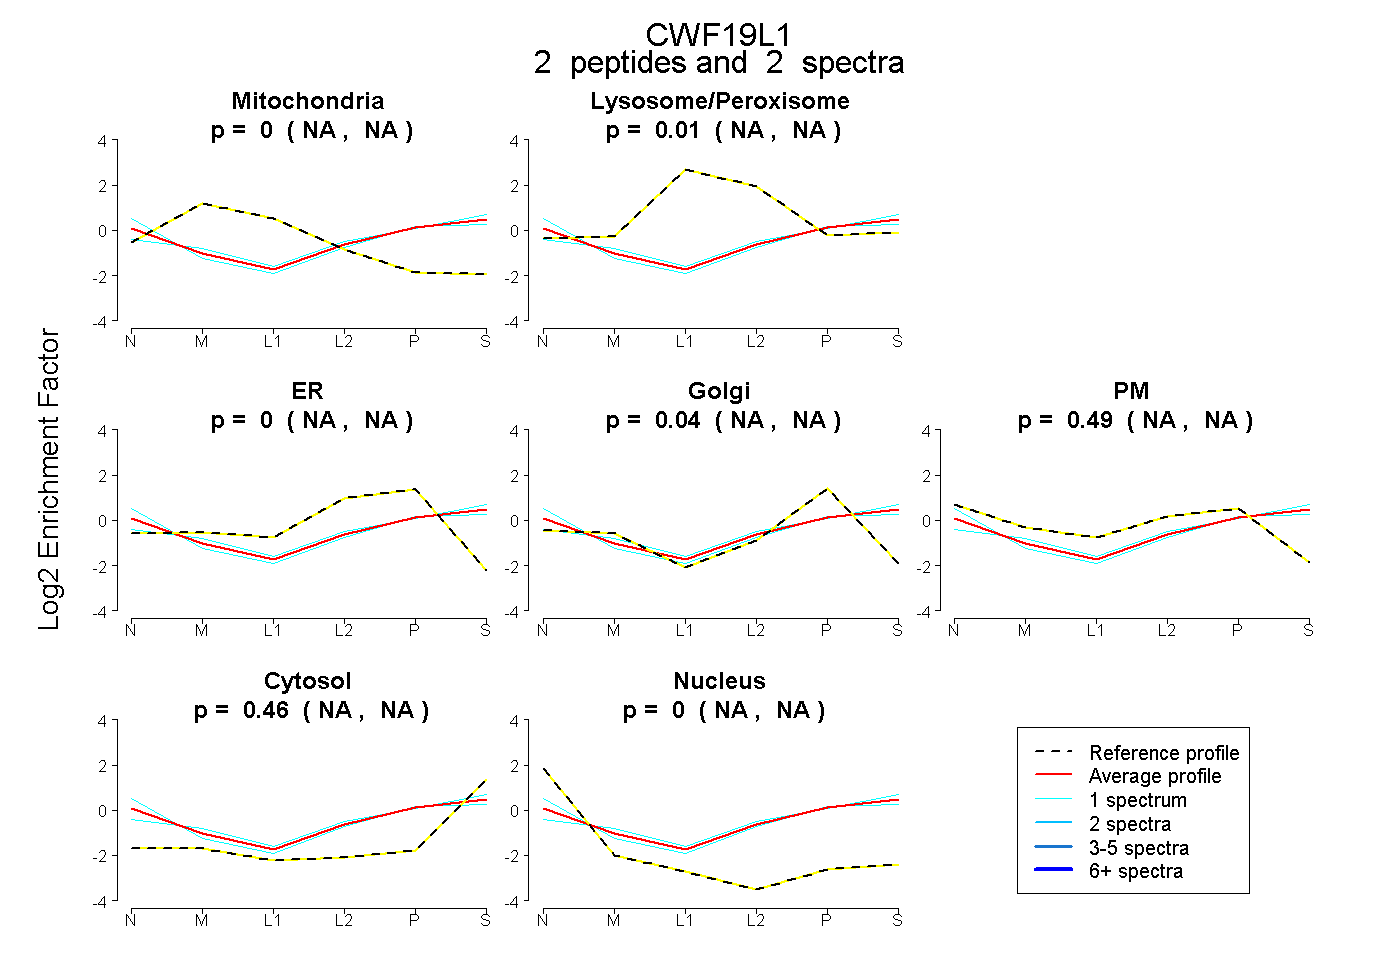
NA | NA
NA | NA
NA | NA
NA | NA
NA | NA
NA | NA
NA | NA
3peptides
spectra
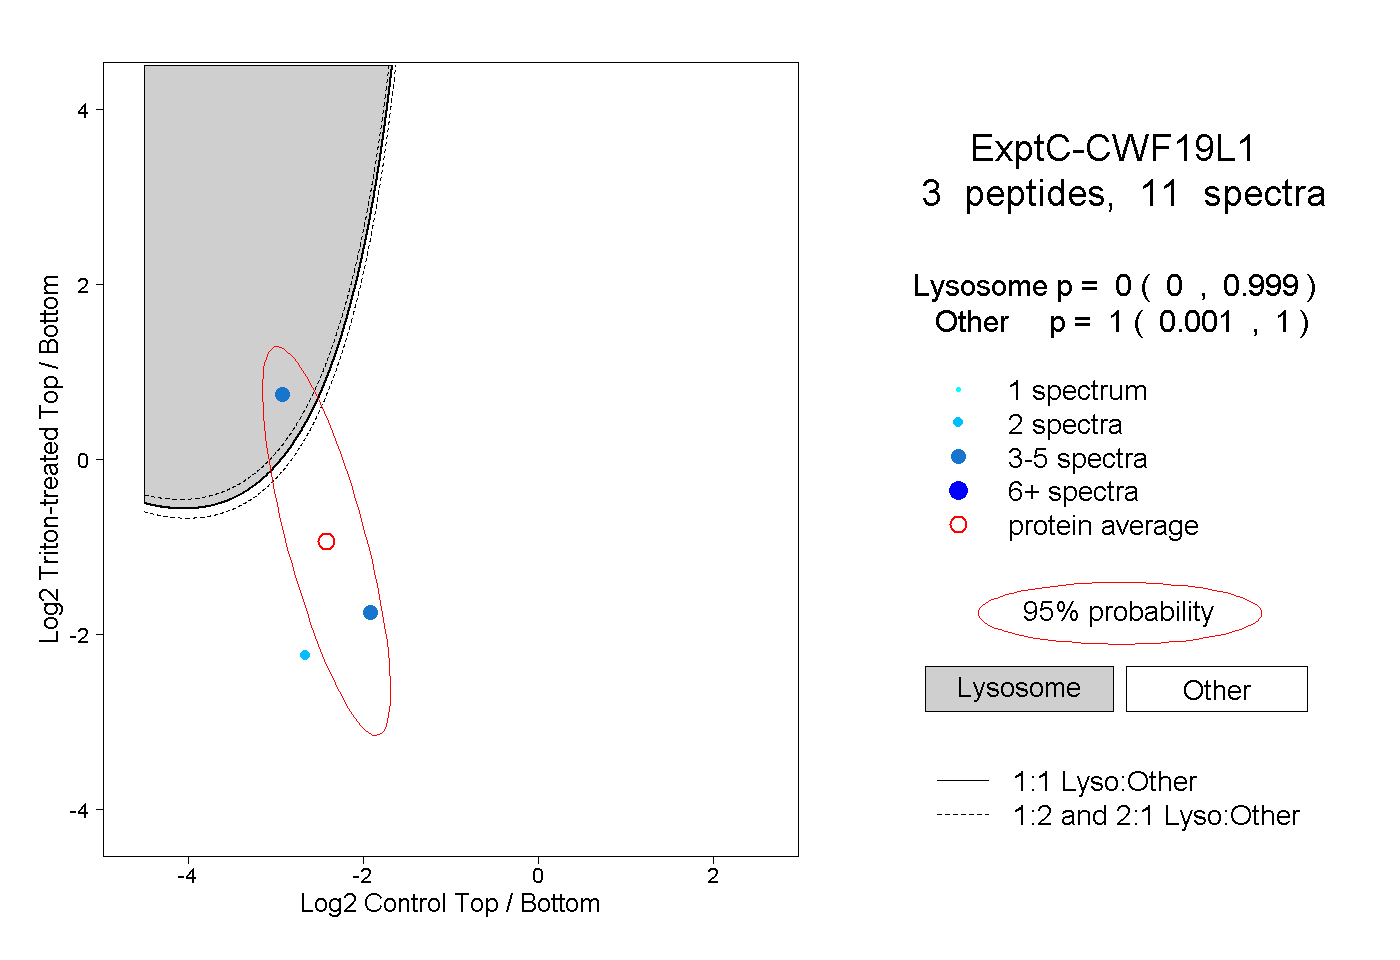
0.000 | 0.999
0.001 | 1.000