 6
6peptides
spectra
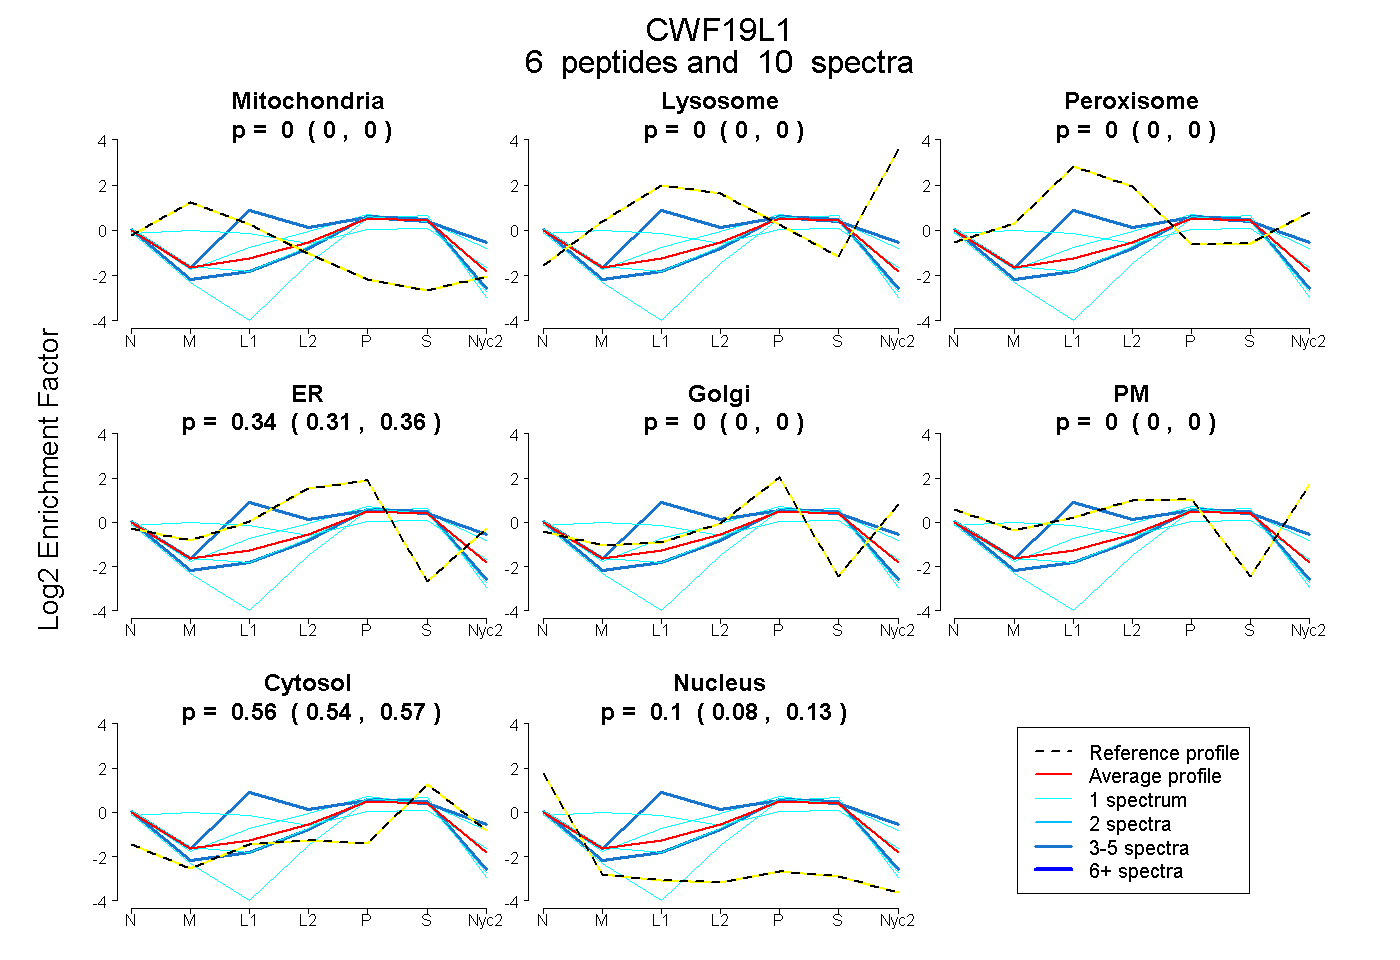
0.000 | 0.000
0.000 | 0.000
0.000 | 0.000
0.310 | 0.358
0.000 | 0.000
0.000 | 0.000
0.540 | 0.570
0.076 | 0.129
| Plot | Mito | Lyso | Perox | ER | Golgi | PM | Cytosol | Nucleus | |||||
| Expt A |
6 peptides |
10 spectra |
|
0.000 0.000 | 0.000 |
0.000 0.000 | 0.000 |
0.000 0.000 | 0.000 |
0.339 0.310 | 0.358 |
0.000 0.000 | 0.000 |
0.000 0.000 | 0.000 |
0.557 0.540 | 0.570 |
0.105 0.076 | 0.129 |
| 1 spectrum, FDVLFNR | 0.000 | 0.000 | 0.000 | 0.000 | 0.104 | 0.000 | 0.566 | 0.331 | ||
| 3 spectra, LMAVAELVK | 0.000 | 0.000 | 0.000 | 0.259 | 0.000 | 0.000 | 0.547 | 0.194 | ||
| 1 spectrum, QCGSALISSLAVSLKPR | 0.000 | 0.000 | 0.000 | 0.298 | 0.000 | 0.000 | 0.502 | 0.200 | ||
| 1 spectrum, DNKPPHAK | 0.000 | 0.000 | 0.000 | 0.434 | 0.000 | 0.001 | 0.565 | 0.000 | ||
| 3 spectra, NFPLQFGR | 0.000 | 0.000 | 0.307 | 0.263 | 0.000 | 0.000 | 0.430 | 0.000 | ||
| 1 spectrum, TMLCSAPQFK | 0.296 | 0.000 | 0.085 | 0.219 | 0.000 | 0.000 | 0.400 | 0.000 |
| Plot | Mito | Lyso or Perox | ER | Golgi | PM | Cytosol | Nucleus | ||||||
| Expt B |
2 peptides |
2 spectra |
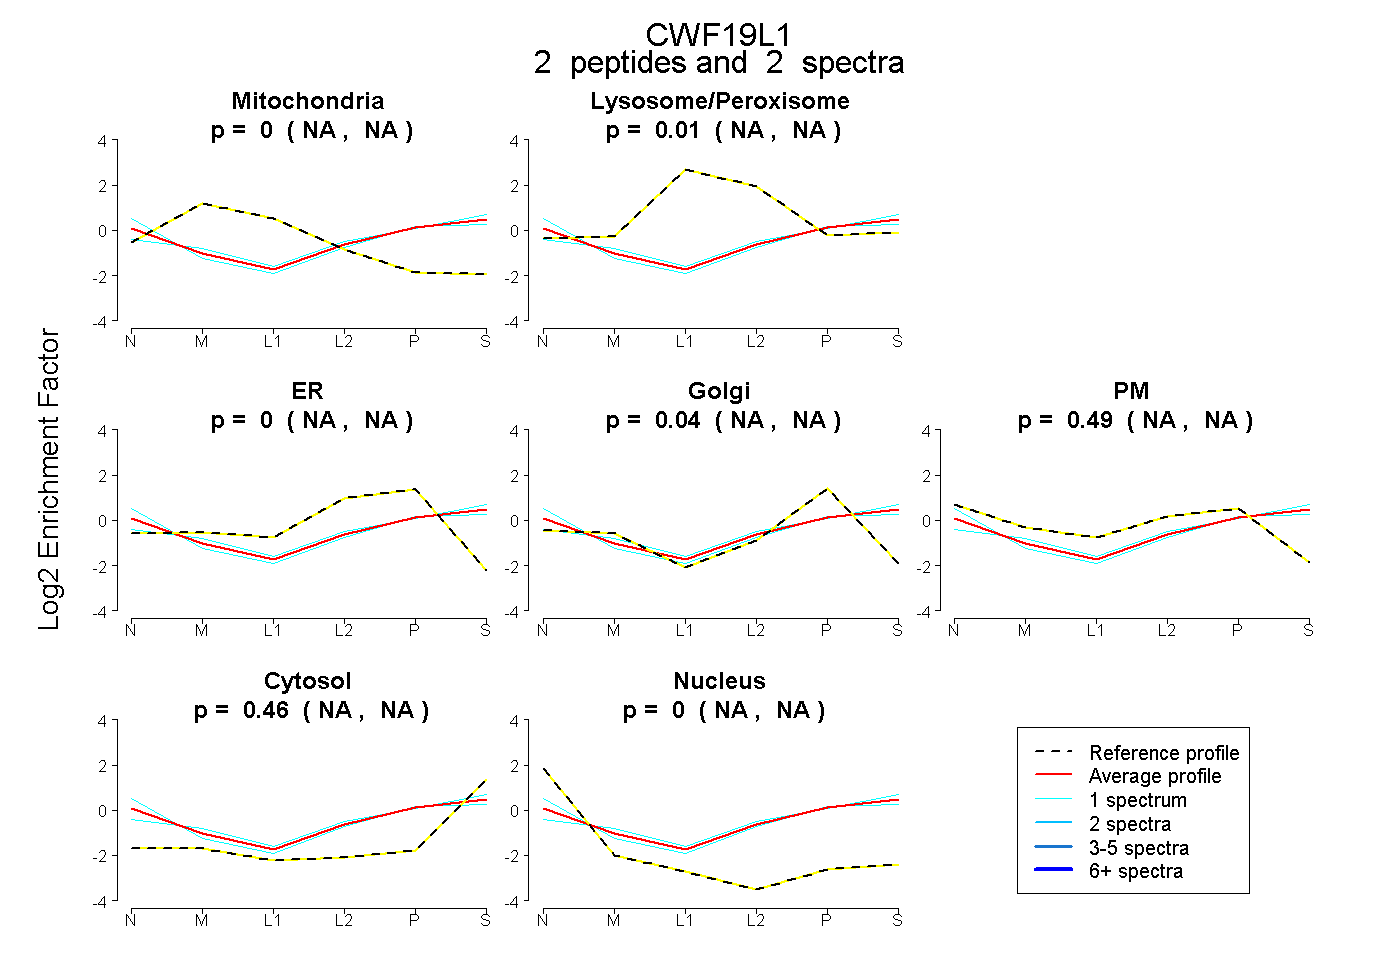 |
0.000 NA | NA |
0.011 NA | NA |
0.000 NA | NA |
0.040 NA | NA |
0.490 NA | NA |
0.458 NA | NA |
0.000 NA | NA |
|||
| Plot | Lyso | Other | |||||||||||
| Expt C |
3 peptides |
11 spectra |
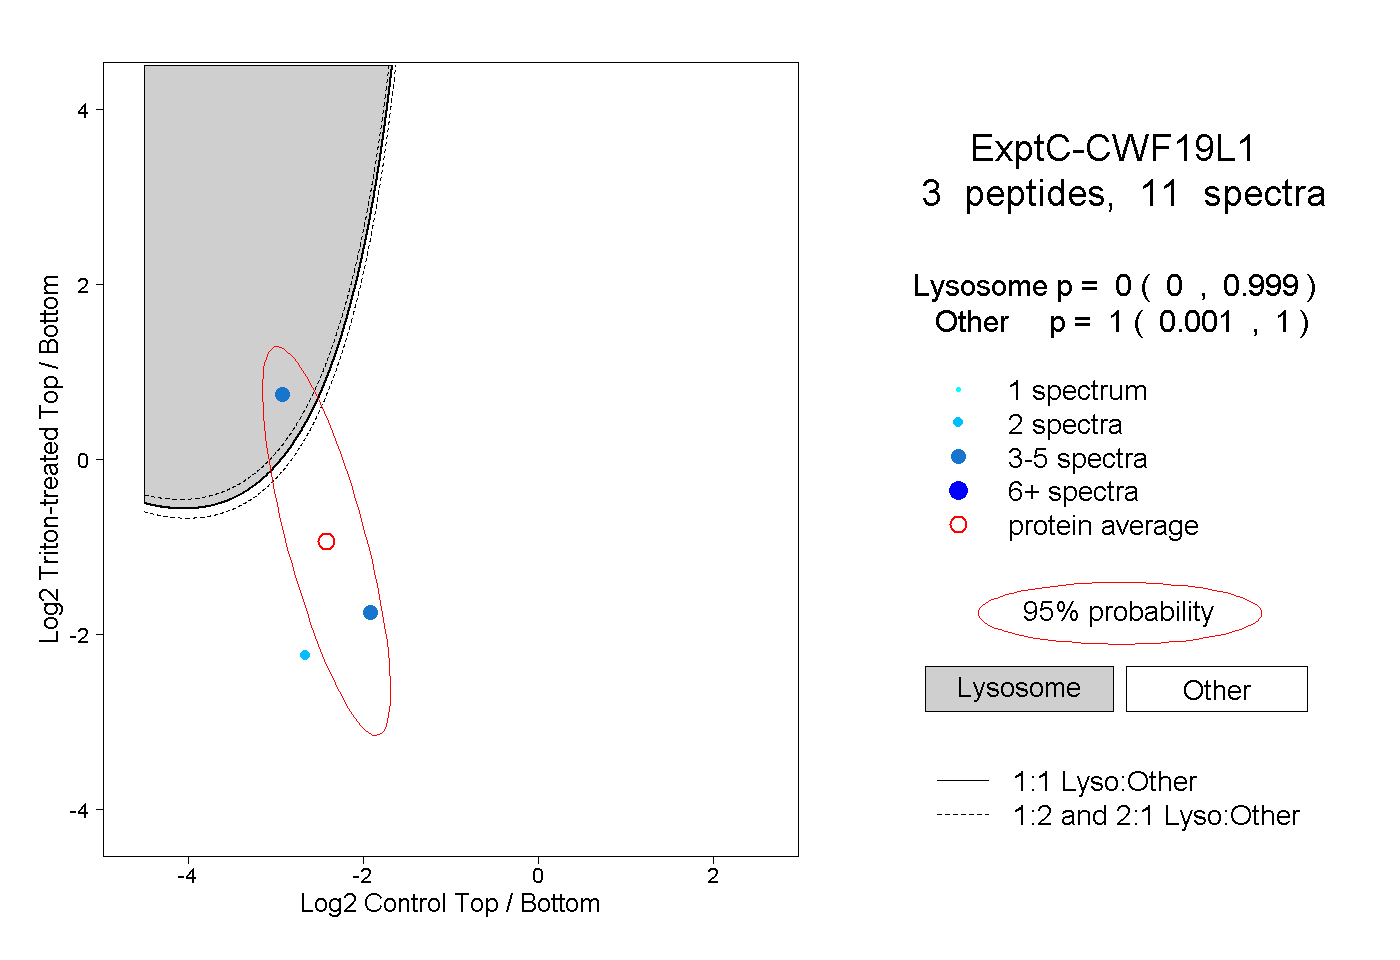 |
0.000 0.000 | 0.999 |
1.000 0.001 | 1.000 |