 9
9peptides
spectra
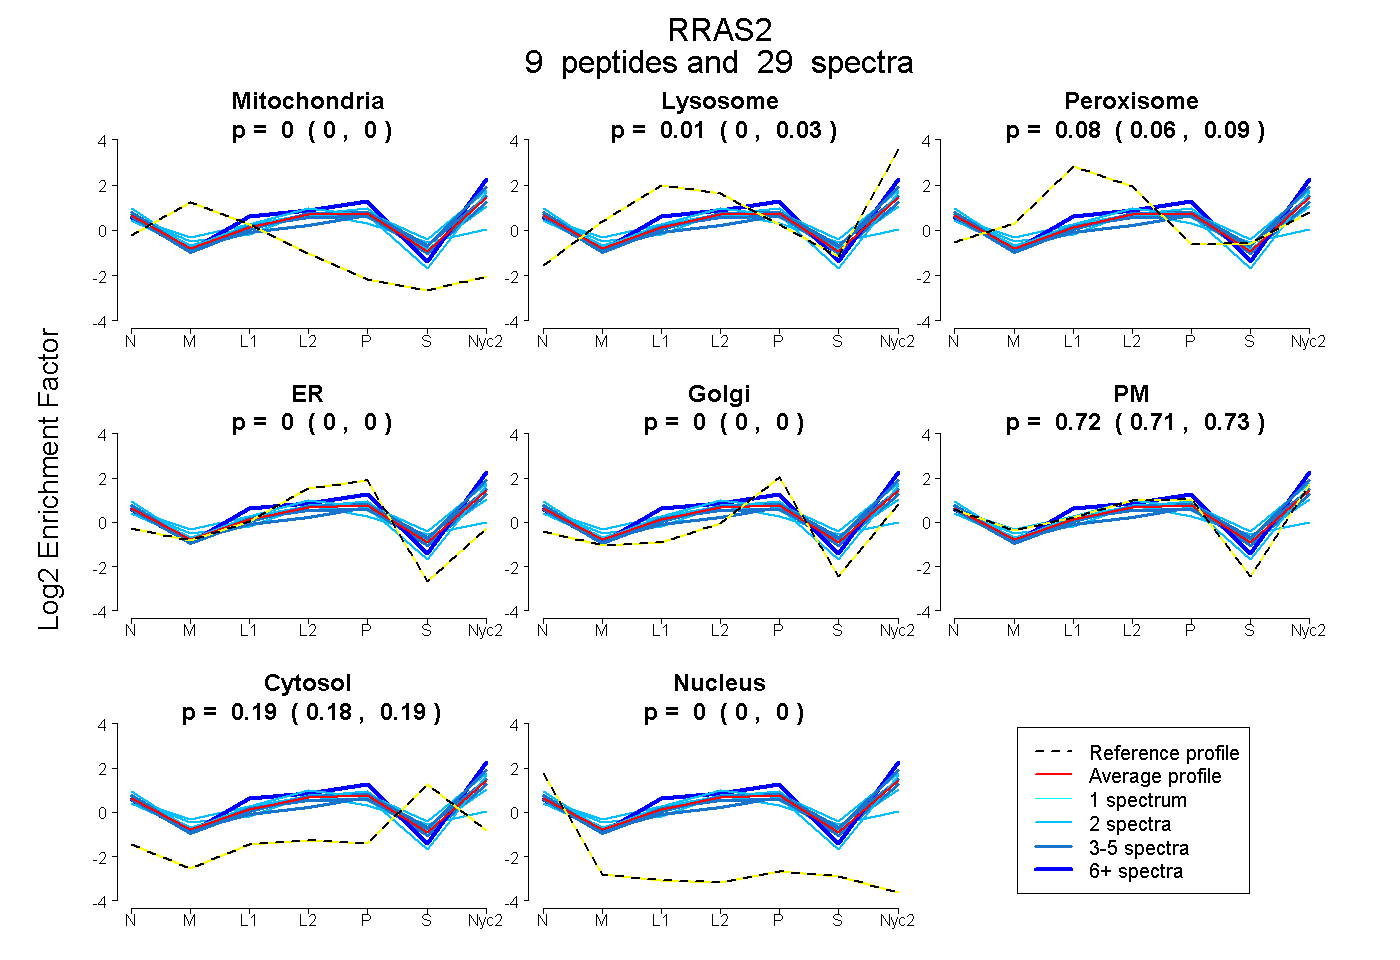
0.000 | 0.000
0.000 | 0.029
0.058 | 0.089
0.000 | 0.000
0.000 | 0.000
0.714 | 0.733
0.181 | 0.192
0.000 | 0.000
1peptide
spectrum
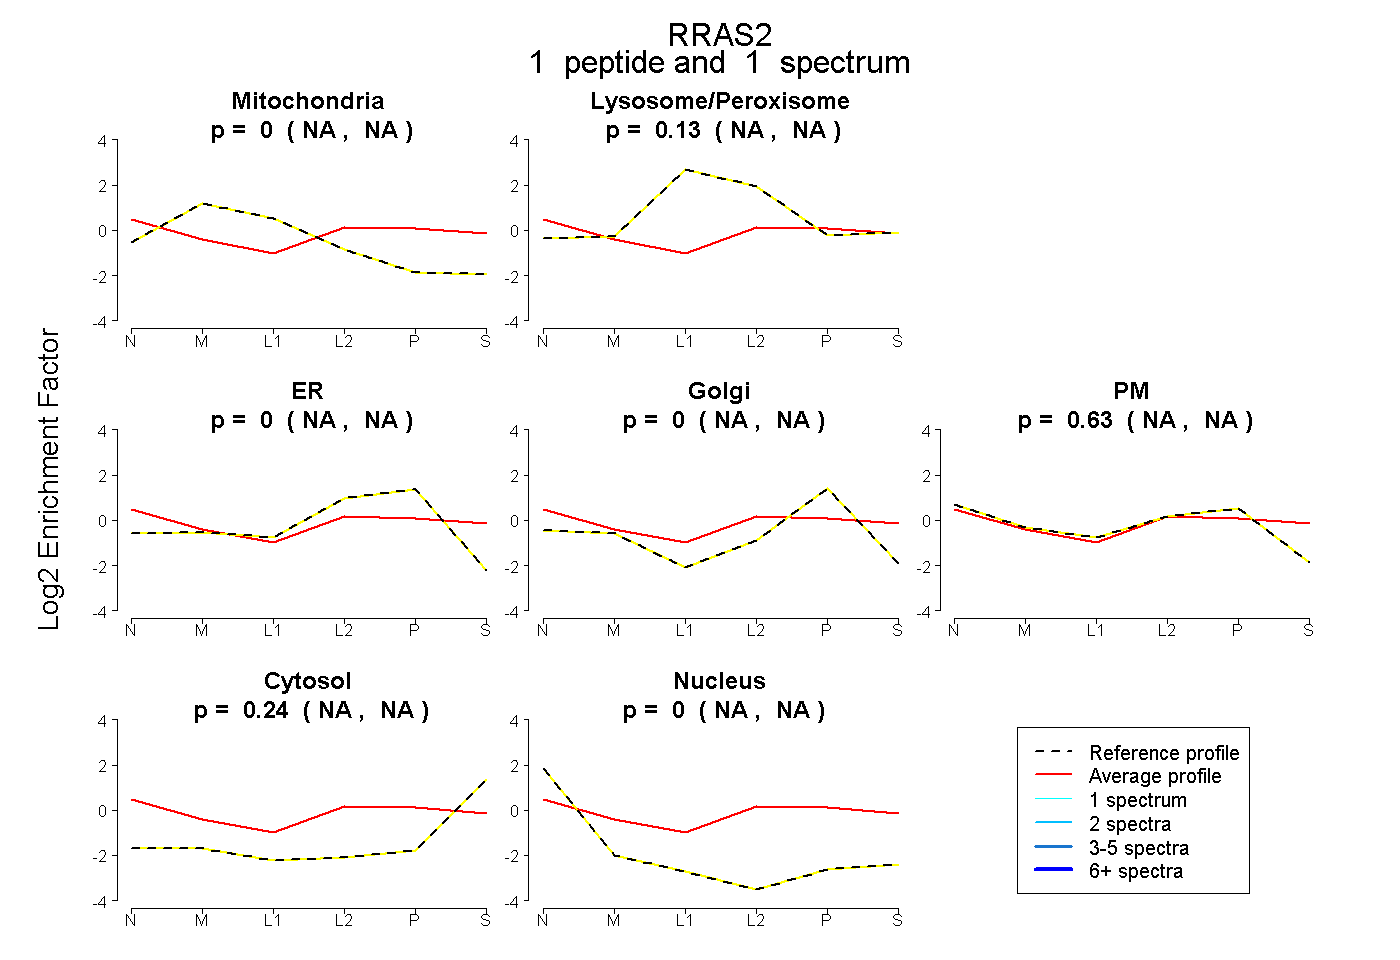
NA | NA
NA | NA
NA | NA
NA | NA
NA | NA
NA | NA
NA | NA
7peptides
spectra
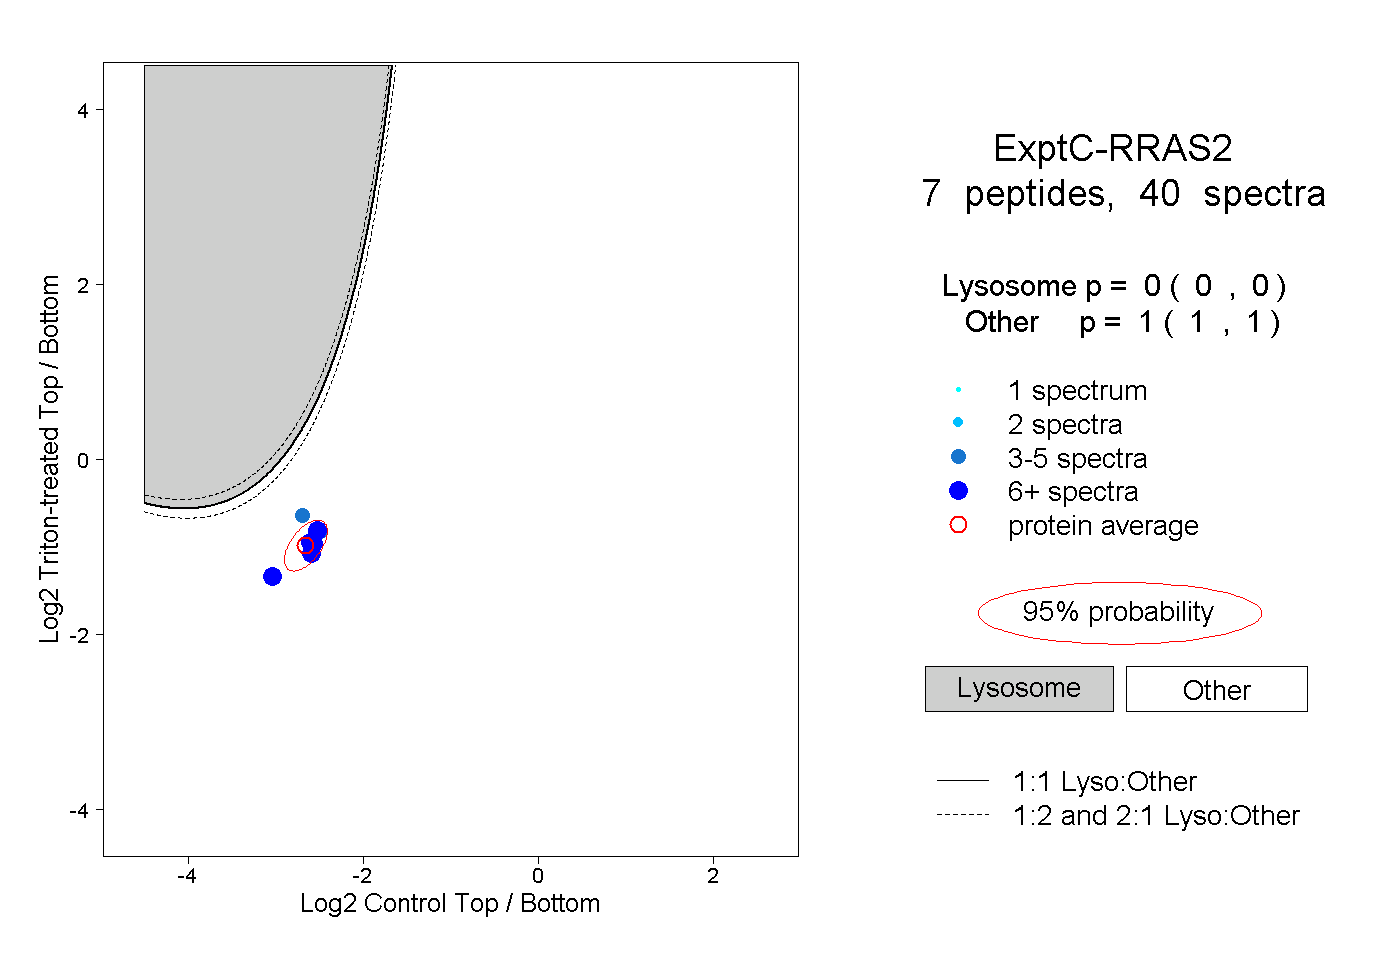
0.000 | 0.000
1.000 | 1.000
2peptides
spectra
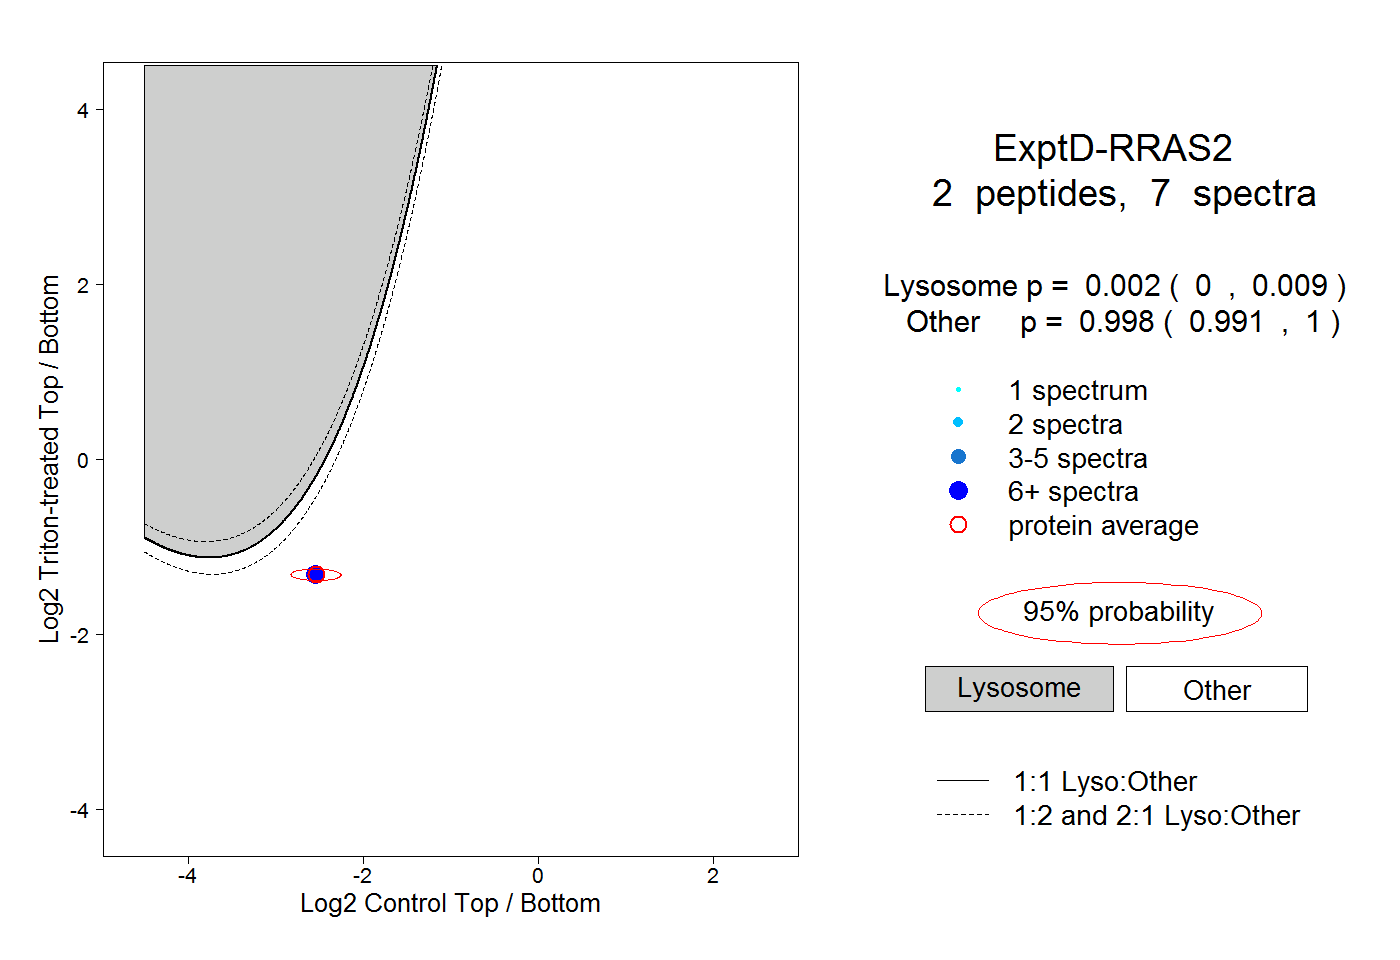
0.000 | 0.009
0.991 | 1.000