 4
4peptides
spectra
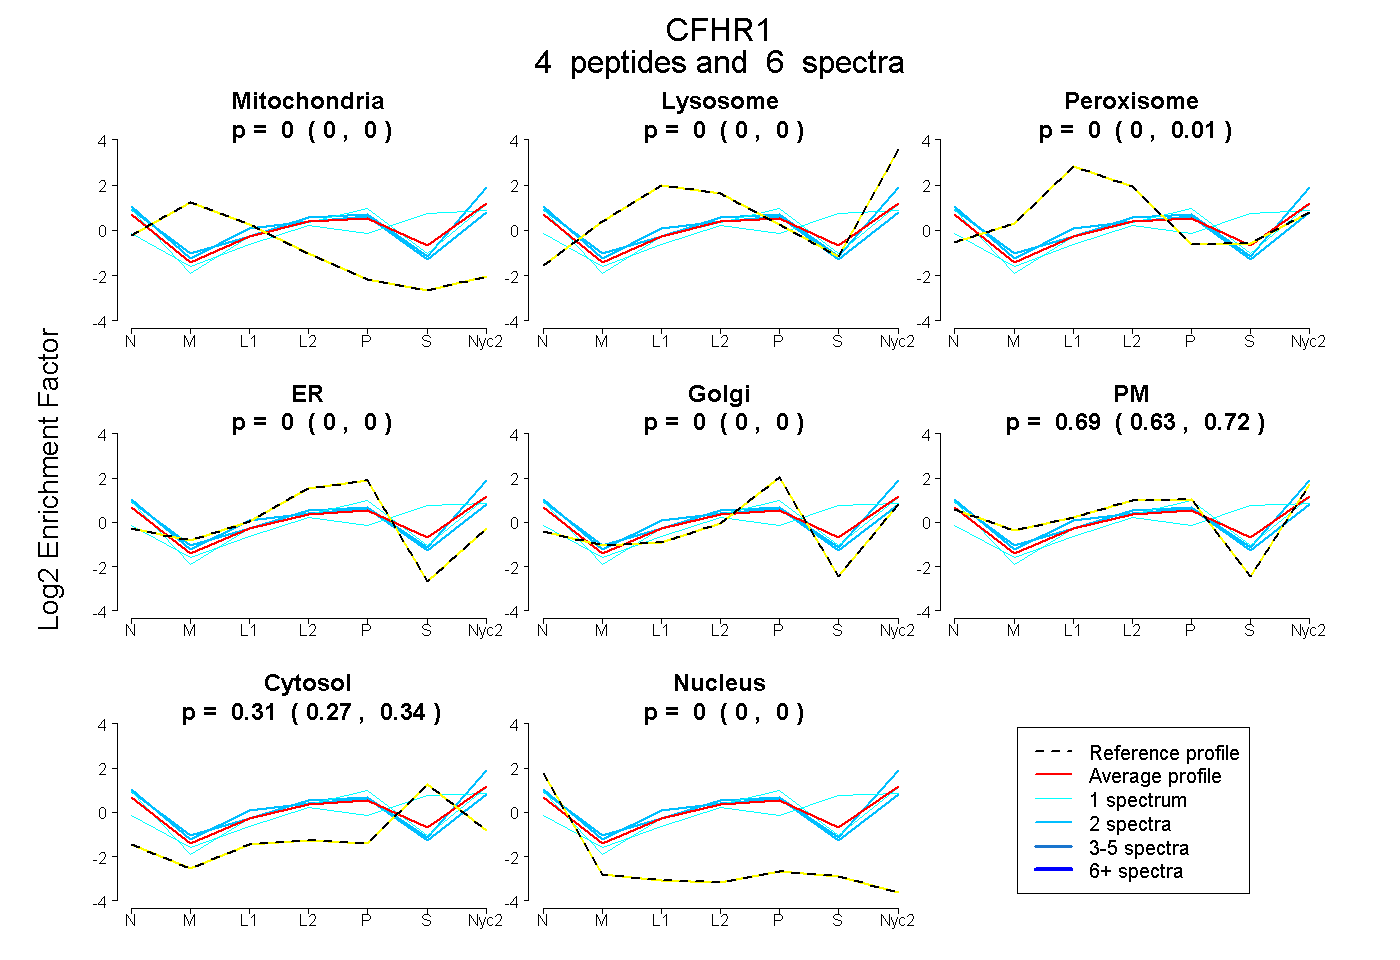
0.000 | 0.000
0.000 | 0.004
0.000 | 0.010
0.000 | 0.000
0.000 | 0.000
0.634 | 0.720
0.272 | 0.344
0.000 | 0.001
4peptides
spectra
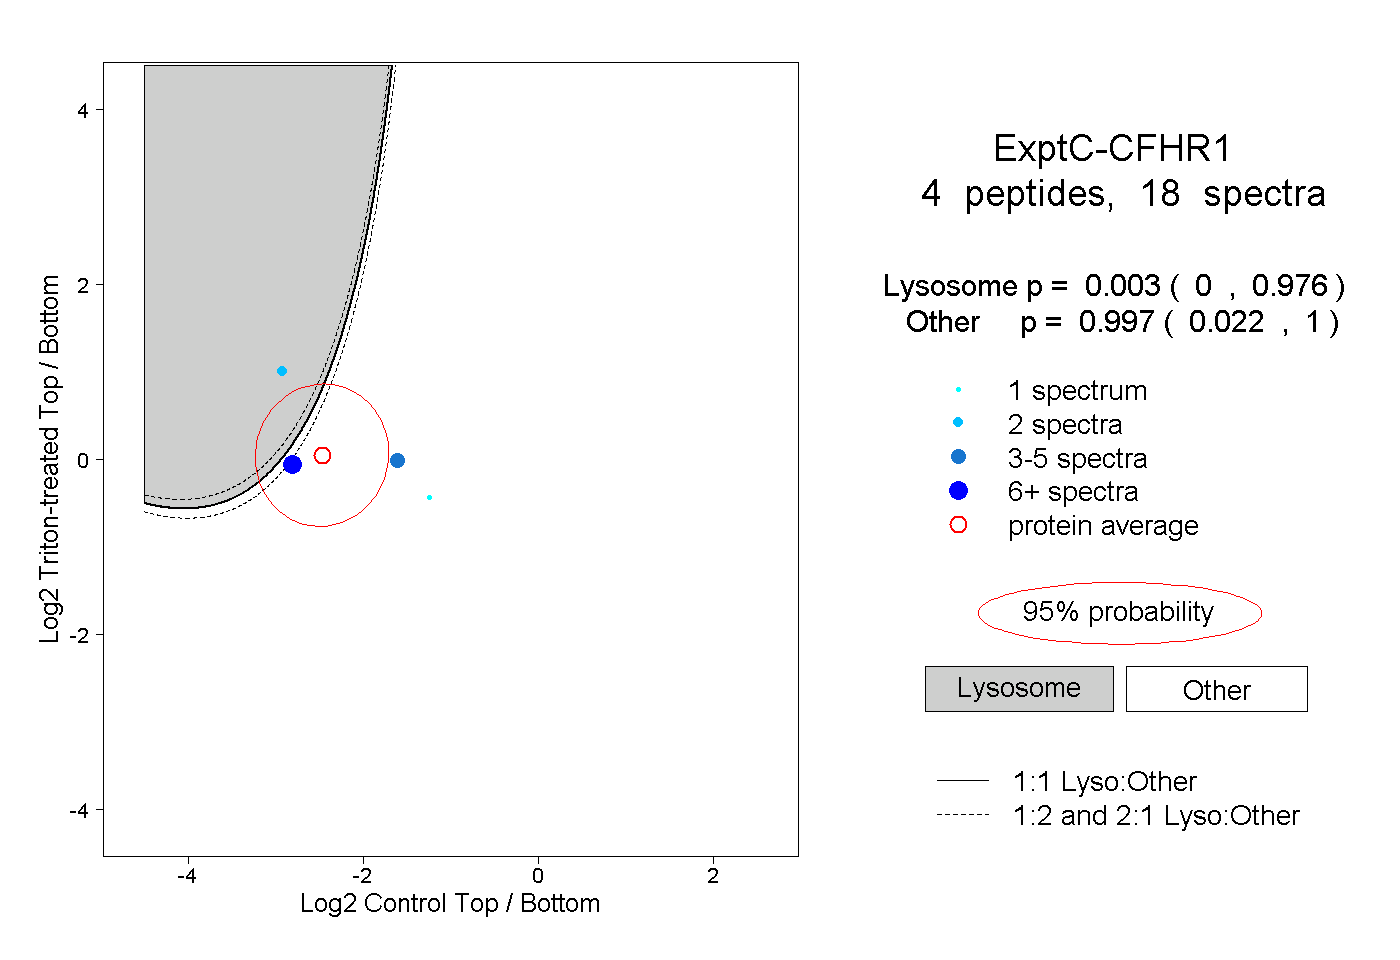
0.000 | 0.976
0.022 | 1.000
1peptide
spectra
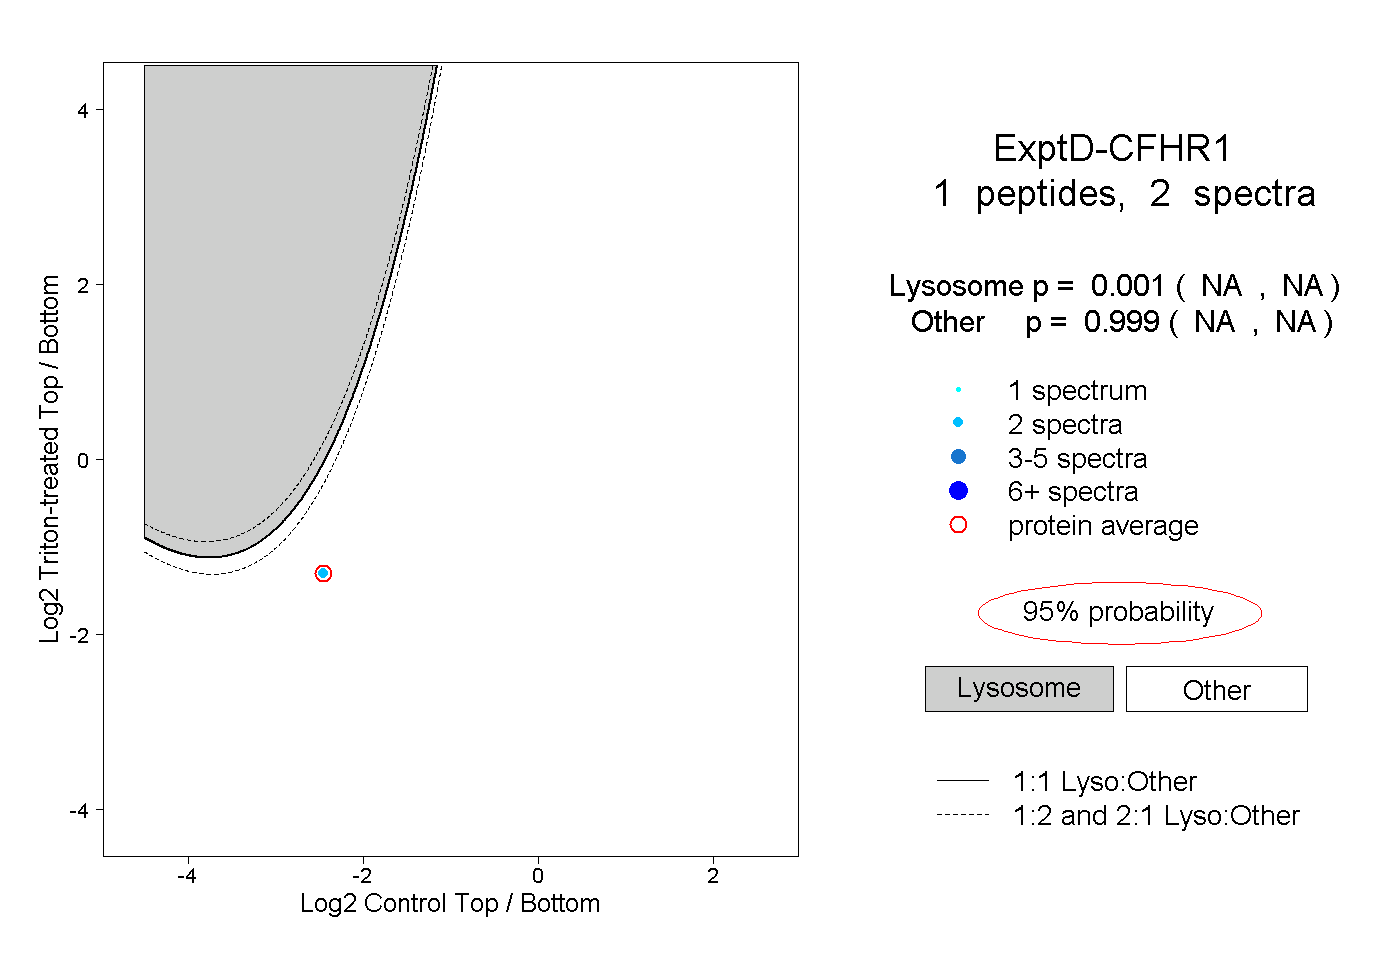
NA | NA
NA | NA