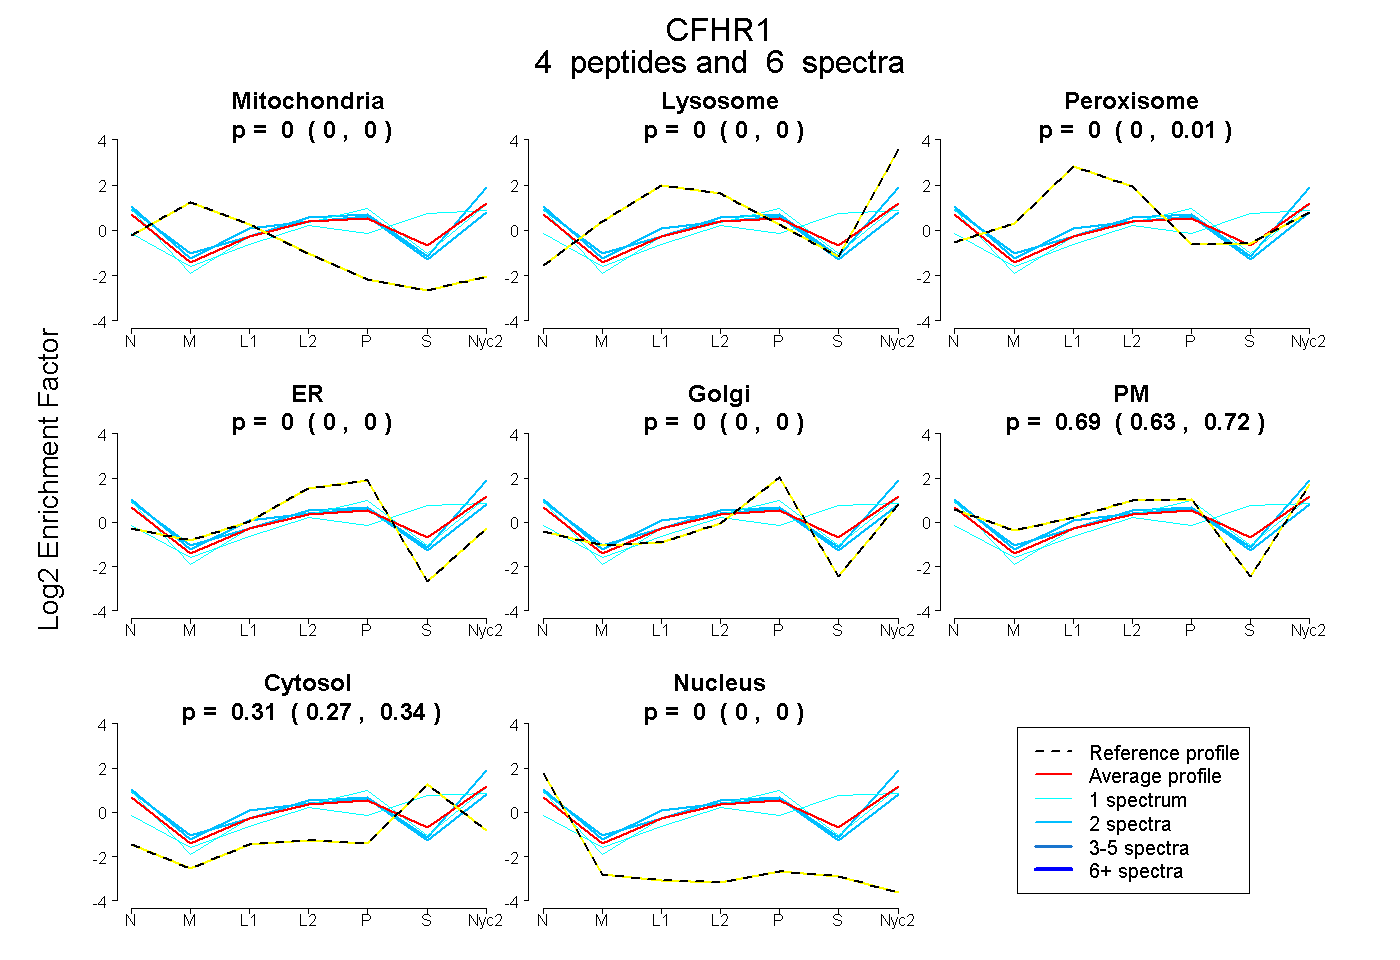
 4
4peptides
spectra
0.000 | 0.000
0.000 | 0.004
0.000 | 0.010
0.000 | 0.000
0.000 | 0.000
0.634 | 0.720
0.272 | 0.344
0.000 | 0.001
| Plot | Mito | Lyso | Perox | ER | Golgi | PM | Cytosol | Nucleus | |||||
| Expt A |
4 peptides |
6 spectra |
|
0.000 0.000 | 0.000 |
0.000 0.000 | 0.004 |
0.000 0.000 | 0.010 |
0.000 0.000 | 0.000 |
0.000 0.000 | 0.000 |
0.688 0.634 | 0.720 |
0.312 0.272 | 0.344 |
0.000 0.000 | 0.001 |
| 2 spectra, CISPNSAGK | 0.000 | 0.000 | 0.000 | 0.000 | 0.000 | 0.818 | 0.182 | 0.000 | ||
| 2 spectra, CIDGHINYPTCL | 0.000 | 0.000 | 0.047 | 0.000 | 0.000 | 0.717 | 0.169 | 0.067 | ||
| 1 spectrum, HGIVYDEK | 0.000 | 0.140 | 0.005 | 0.000 | 0.000 | 0.292 | 0.564 | 0.000 | ||
| 1 spectrum, WSDPPTCLHACVIPEDILEK | 0.000 | 0.000 | 0.000 | 0.000 | 0.061 | 0.676 | 0.256 | 0.007 |
| Plot | Lyso | Other | |||||||||||
| Expt C |
4 peptides |
18 spectra |
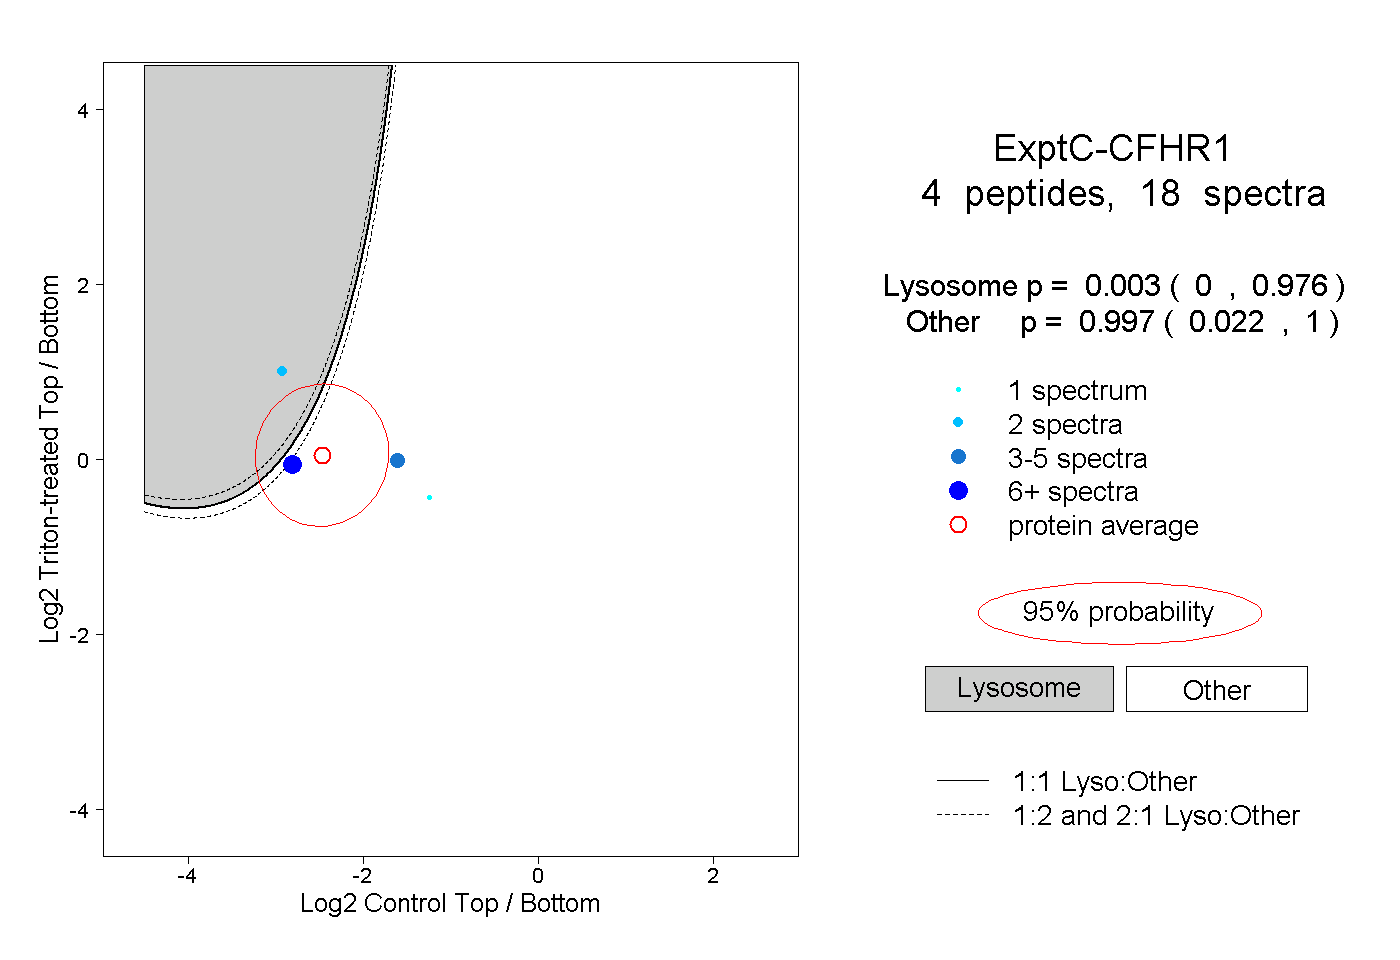 |
0.003 0.000 | 0.976 |
0.997 0.022 | 1.000 |
||||||||
| Plot | Lyso | Other | |||||||||||
| Expt D |
1 peptide |
2 spectra |
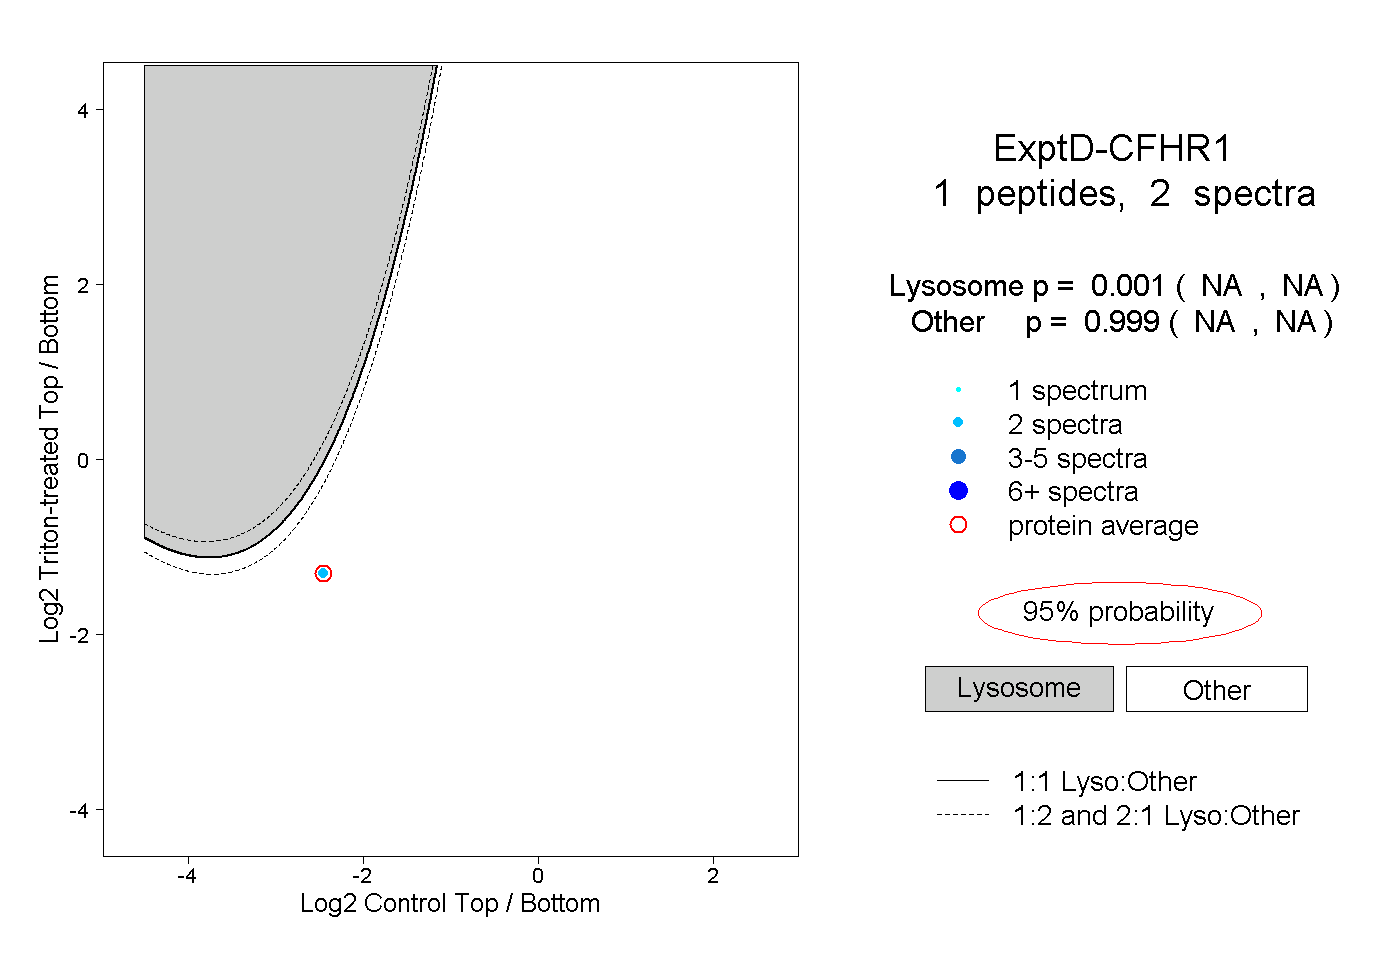 |
0.001 NA | NA |
0.999 NA | NA |