 9
9peptides
spectra
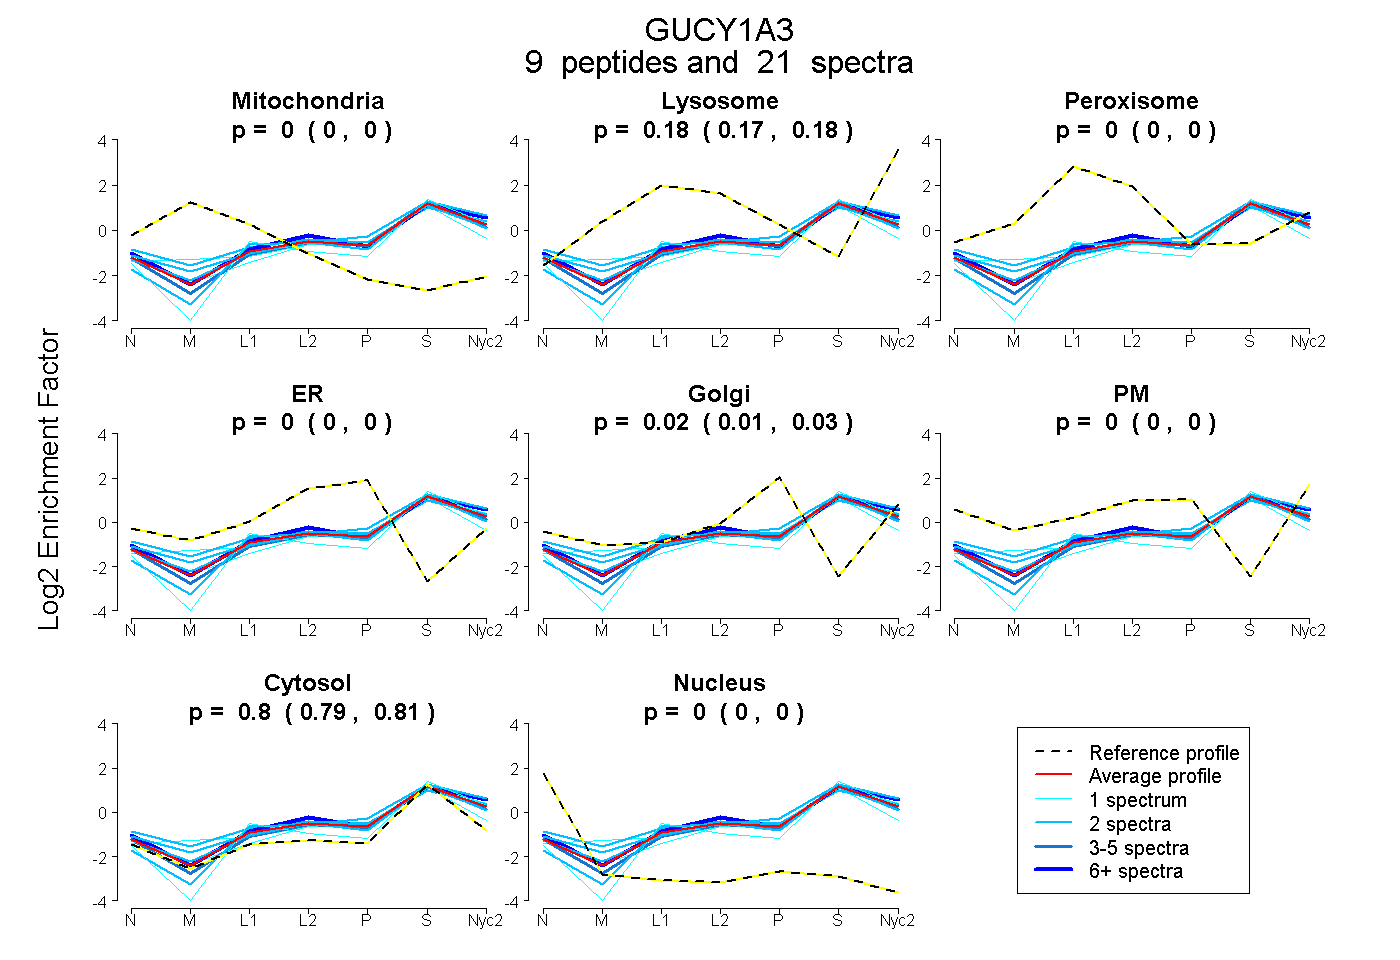
0.000 | 0.000
0.167 | 0.183
0.000 | 0.000
0.000 | 0.000
0.014 | 0.028
0.000 | 0.002
0.795 | 0.807
0.000 | 0.000
8peptides
spectra
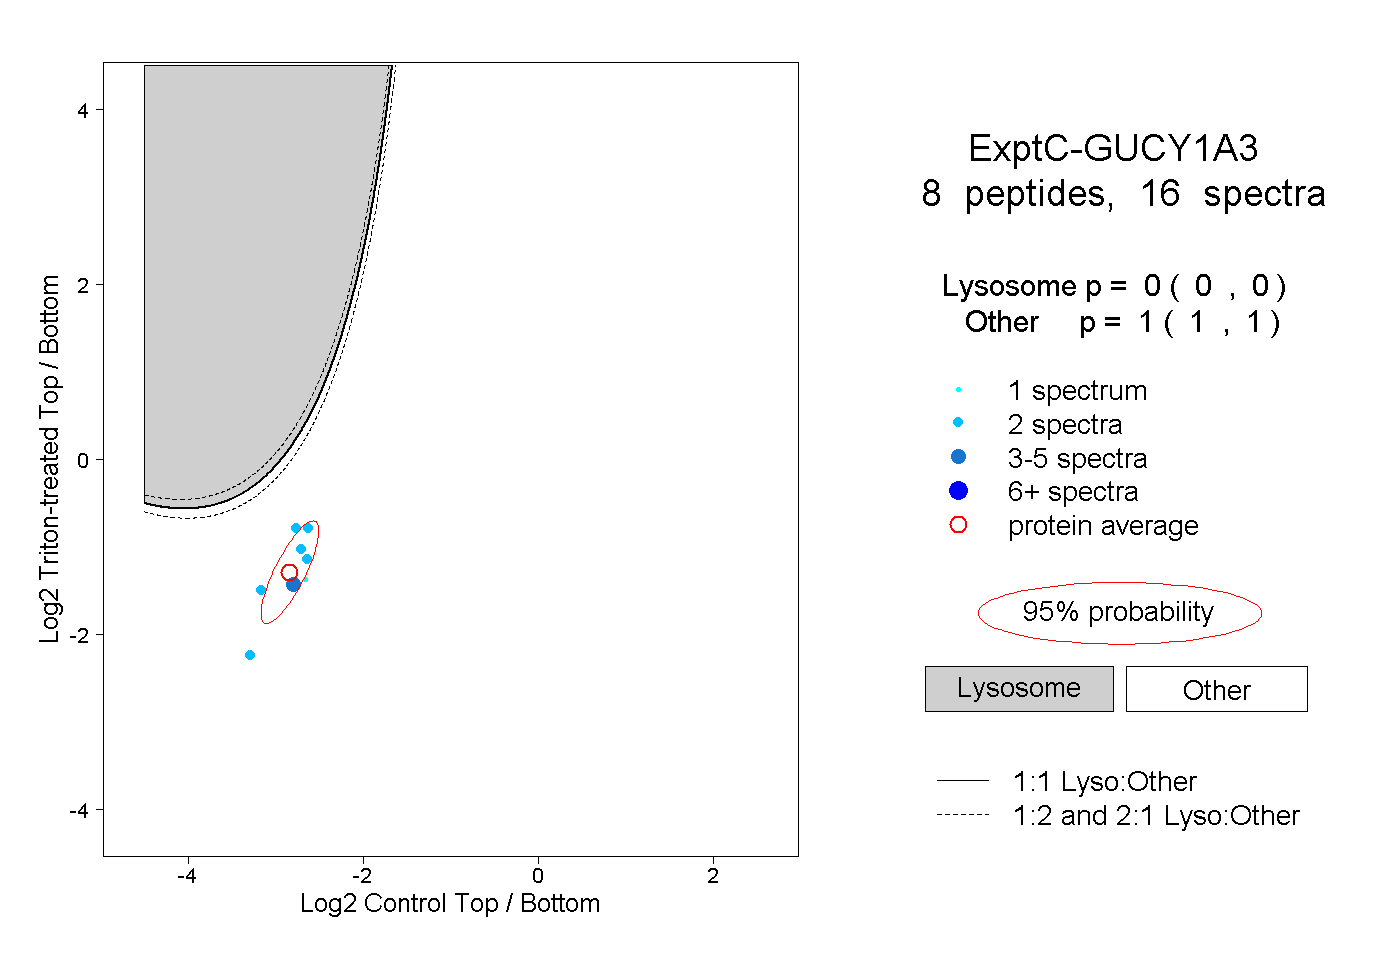
0.000 | 0.000
1.000 | 1.000
2peptides
spectra
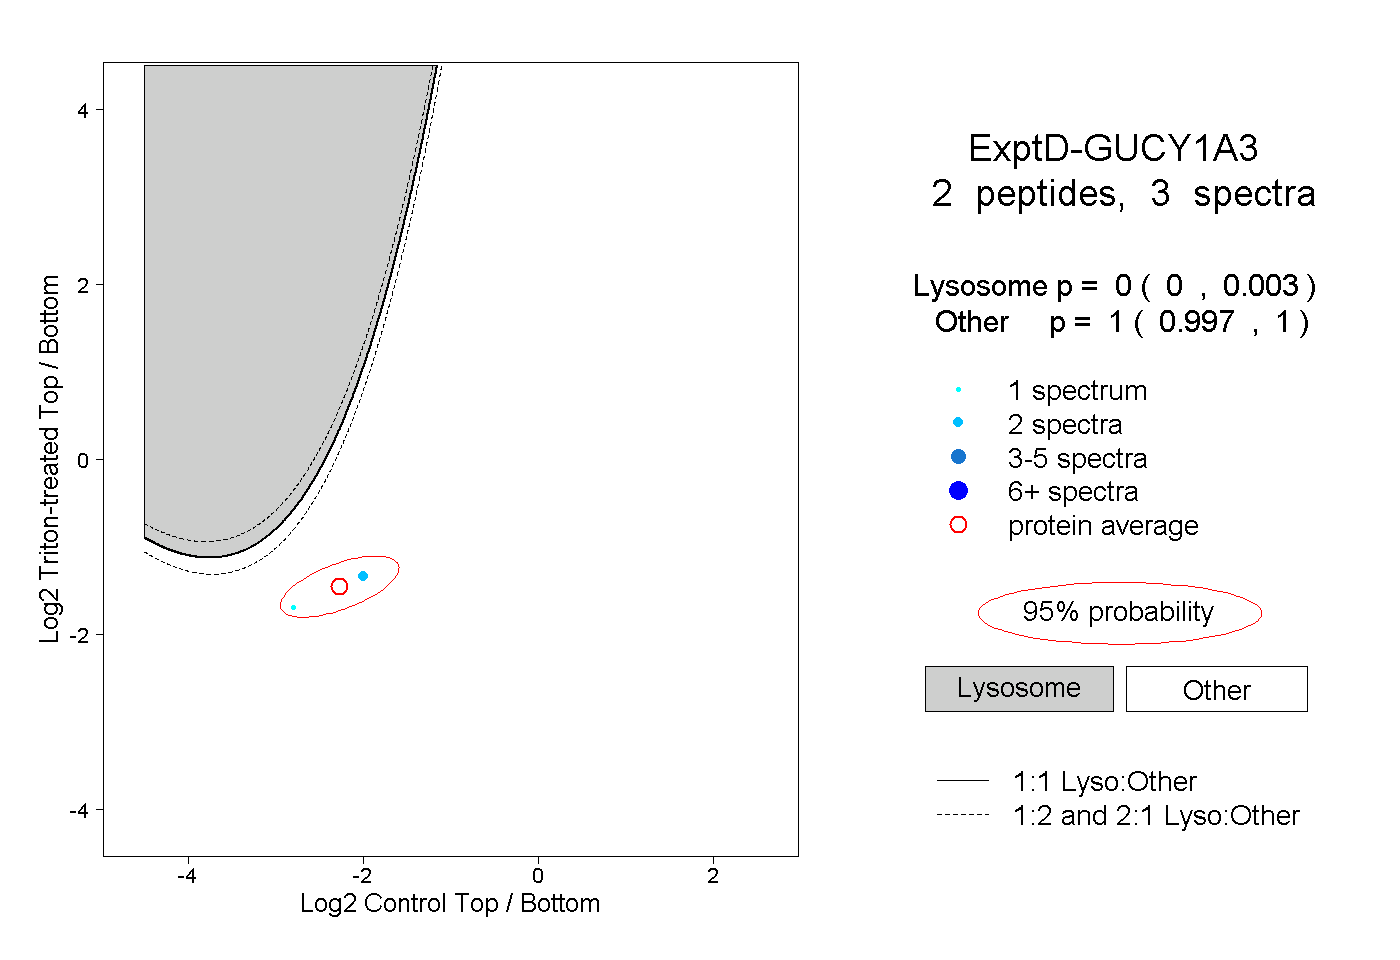
0.000 | 0.003
0.997 | 1.000