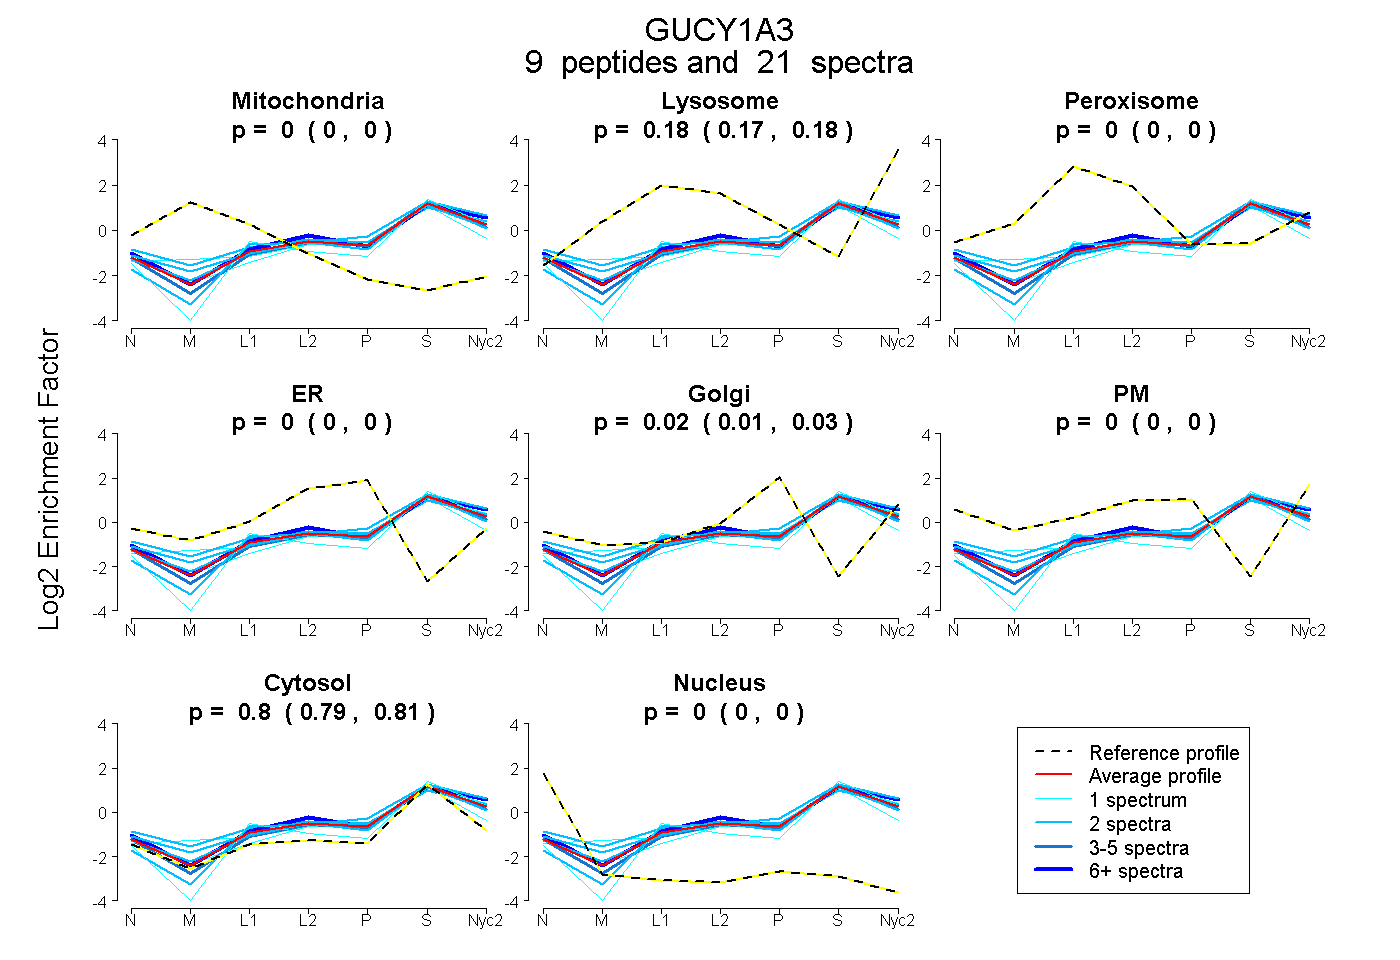
 9
9peptides
spectra
0.000 | 0.000
0.167 | 0.183
0.000 | 0.000
0.000 | 0.000
0.014 | 0.028
0.000 | 0.002
0.795 | 0.807
0.000 | 0.000
| Plot | Mito | Lyso | Perox | ER | Golgi | PM | Cytosol | Nucleus | |||||
| Expt A |
9 peptides |
21 spectra |
|
0.000 0.000 | 0.000 |
0.176 0.167 | 0.183 |
0.000 0.000 | 0.000 |
0.000 0.000 | 0.000 |
0.022 0.014 | 0.028 |
0.000 0.000 | 0.002 |
0.802 0.795 | 0.807 |
0.000 0.000 | 0.000 |
| 2 spectra, TFPFHFMLDR | 0.000 | 0.196 | 0.000 | 0.000 | 0.000 | 0.000 | 0.804 | 0.000 | ||
| 3 spectra, LIFPEFER | 0.000 | 0.124 | 0.000 | 0.000 | 0.033 | 0.000 | 0.843 | 0.000 | ||
| 7 spectra, DSLGEELFK | 0.000 | 0.207 | 0.000 | 0.000 | 0.000 | 0.029 | 0.764 | 0.000 | ||
| 1 spectrum, ATLEHAHQALEEEK | 0.000 | 0.114 | 0.000 | 0.000 | 0.101 | 0.000 | 0.785 | 0.000 | ||
| 1 spectrum, TTALLLPGIIK | 0.000 | 0.086 | 0.000 | 0.000 | 0.000 | 0.000 | 0.914 | 0.000 | ||
| 2 spectra, DFQGKPNFEEFFEILTPK | 0.000 | 0.177 | 0.008 | 0.000 | 0.000 | 0.111 | 0.704 | 0.000 | ||
| 2 spectra, DVVLIGEQAR | 0.000 | 0.159 | 0.000 | 0.001 | 0.020 | 0.056 | 0.764 | 0.000 | ||
| 2 spectra, LNLALQR | 0.000 | 0.164 | 0.000 | 0.000 | 0.000 | 0.004 | 0.832 | 0.000 | ||
| 1 spectrum, DFLNSFSTLLK | 0.016 | 0.119 | 0.021 | 0.040 | 0.025 | 0.000 | 0.778 | 0.000 |
| Plot | Lyso | Other | |||||||||||
| Expt C |
8 peptides |
16 spectra |
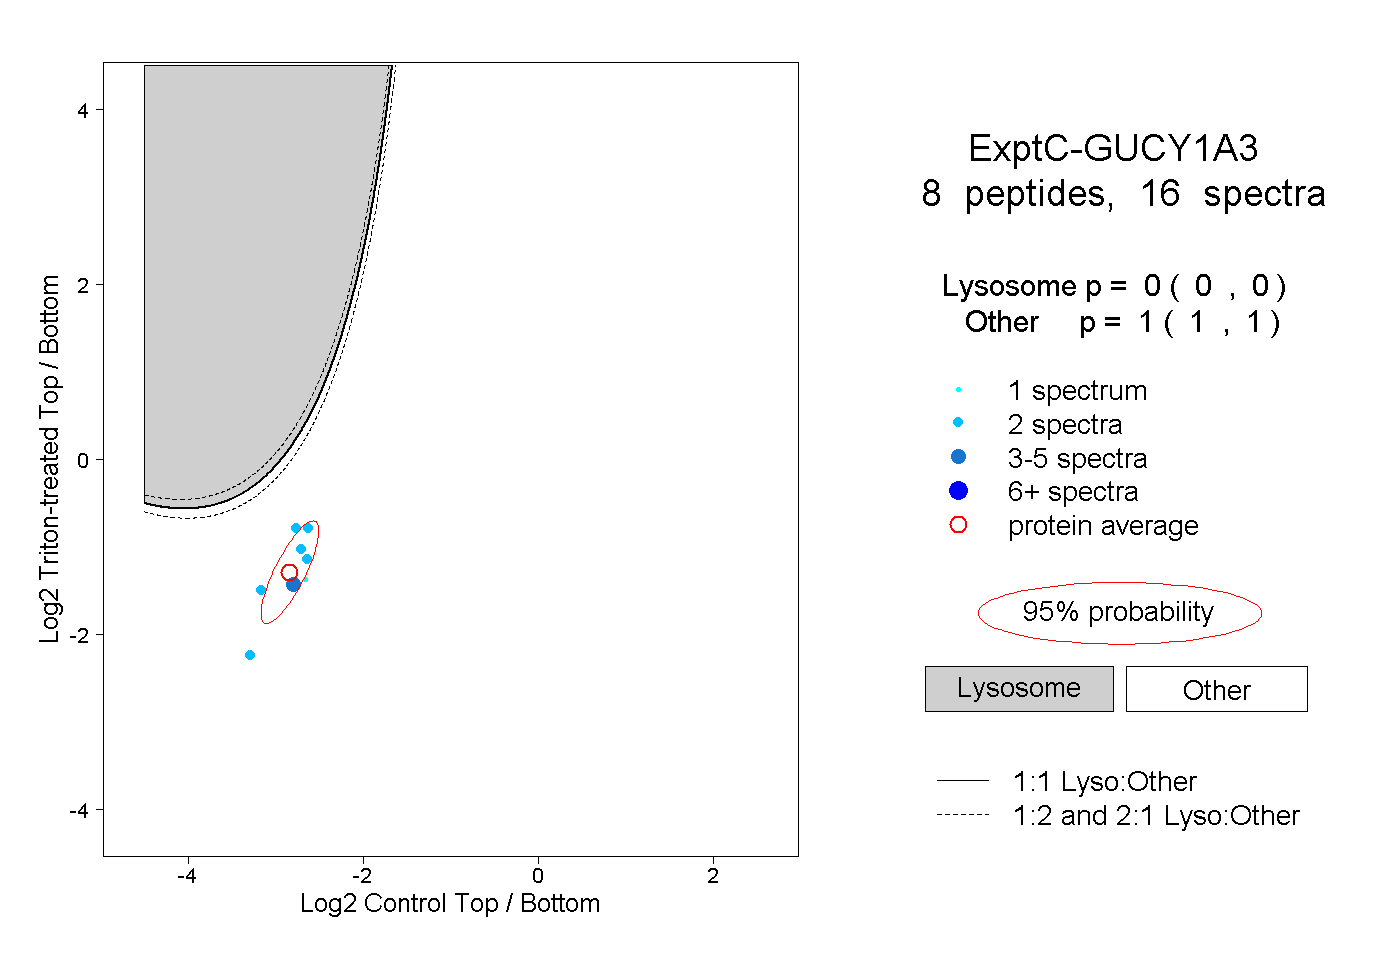 |
0.000 0.000 | 0.000 |
1.000 1.000 | 1.000 |
||||||||
| Plot | Lyso | Other | |||||||||||
| Expt D |
2 peptides |
3 spectra |
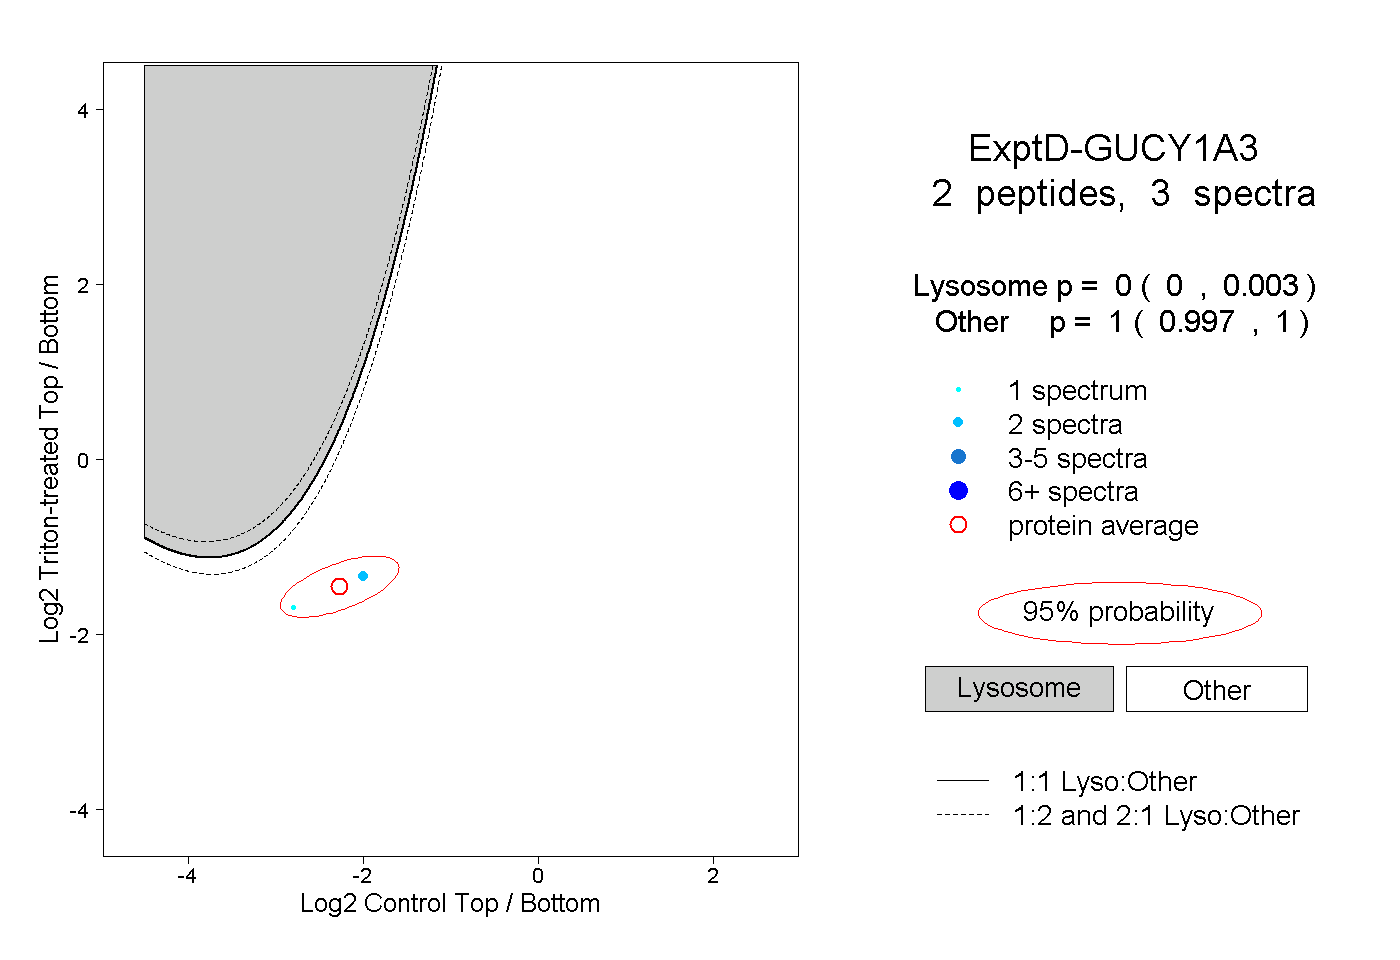 |
0.000 0.000 | 0.003 |
1.000 0.997 | 1.000 |