 6
6peptides
spectra
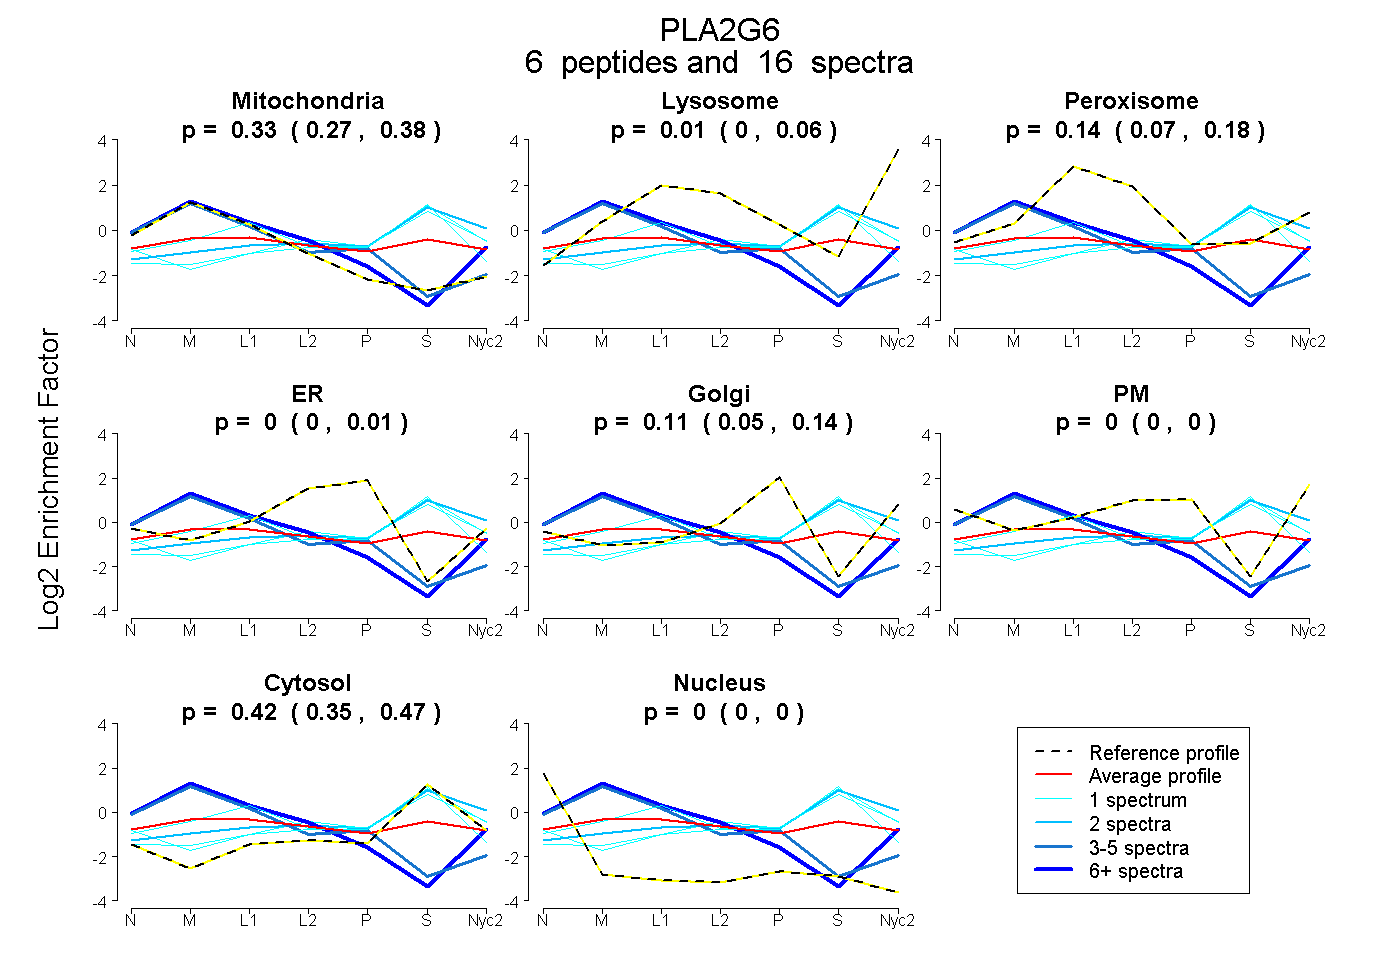
0.266 | 0.380
0.000 | 0.060
0.066 | 0.176
0.000 | 0.008
0.050 | 0.144
0.000 | 0.000
0.354 | 0.474
0.000 | 0.000
4peptides
spectra
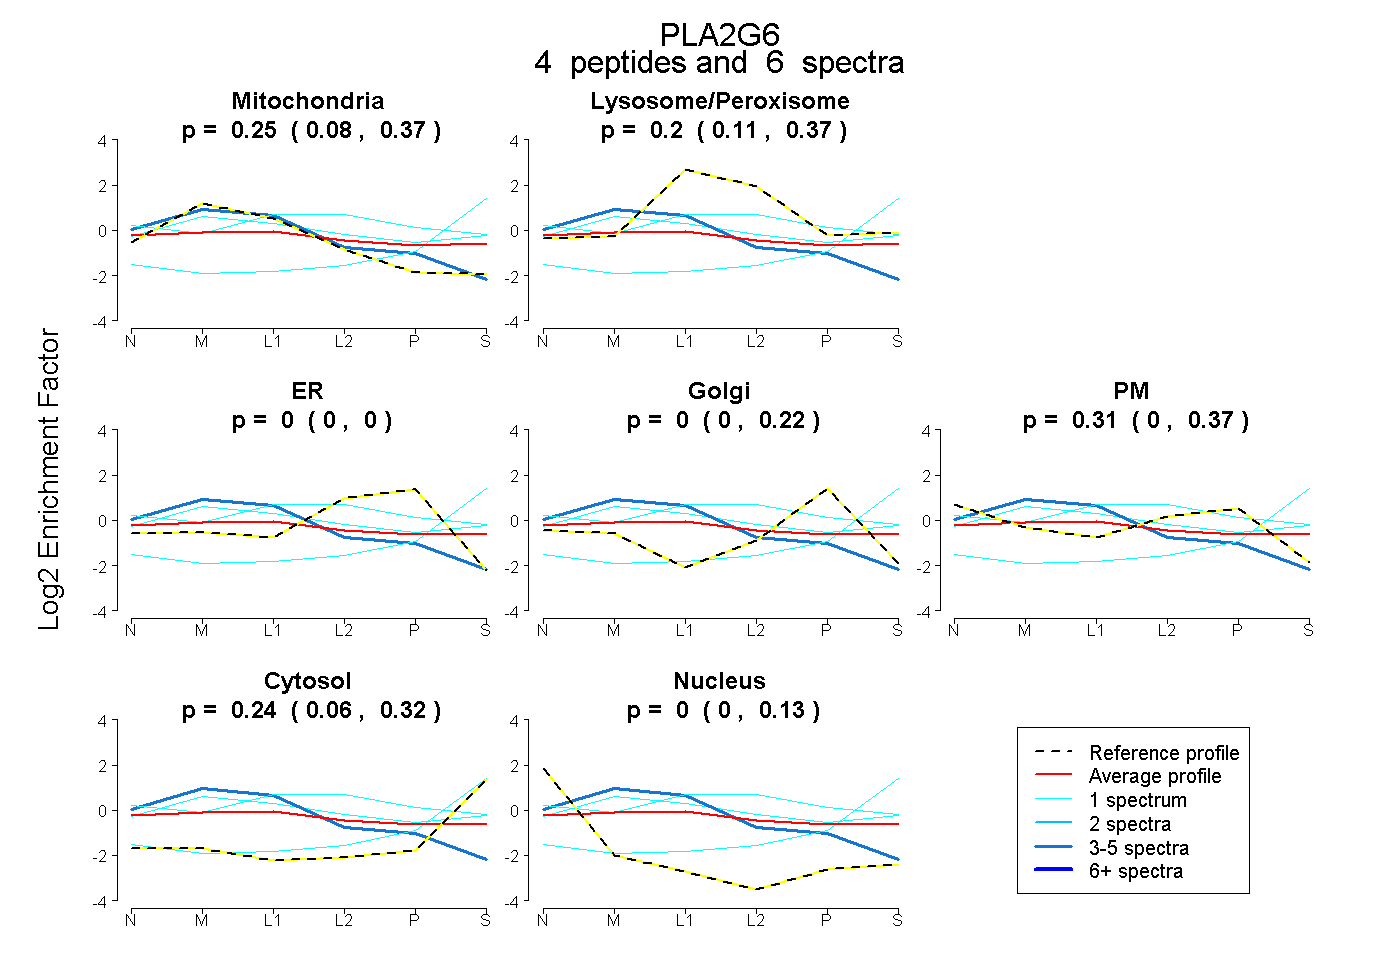
0.075 | 0.373
0.109 | 0.373
0.000 | 0.003
0.000 | 0.218
0.000 | 0.366
0.064 | 0.318
0.000 | 0.135
2peptides
spectra
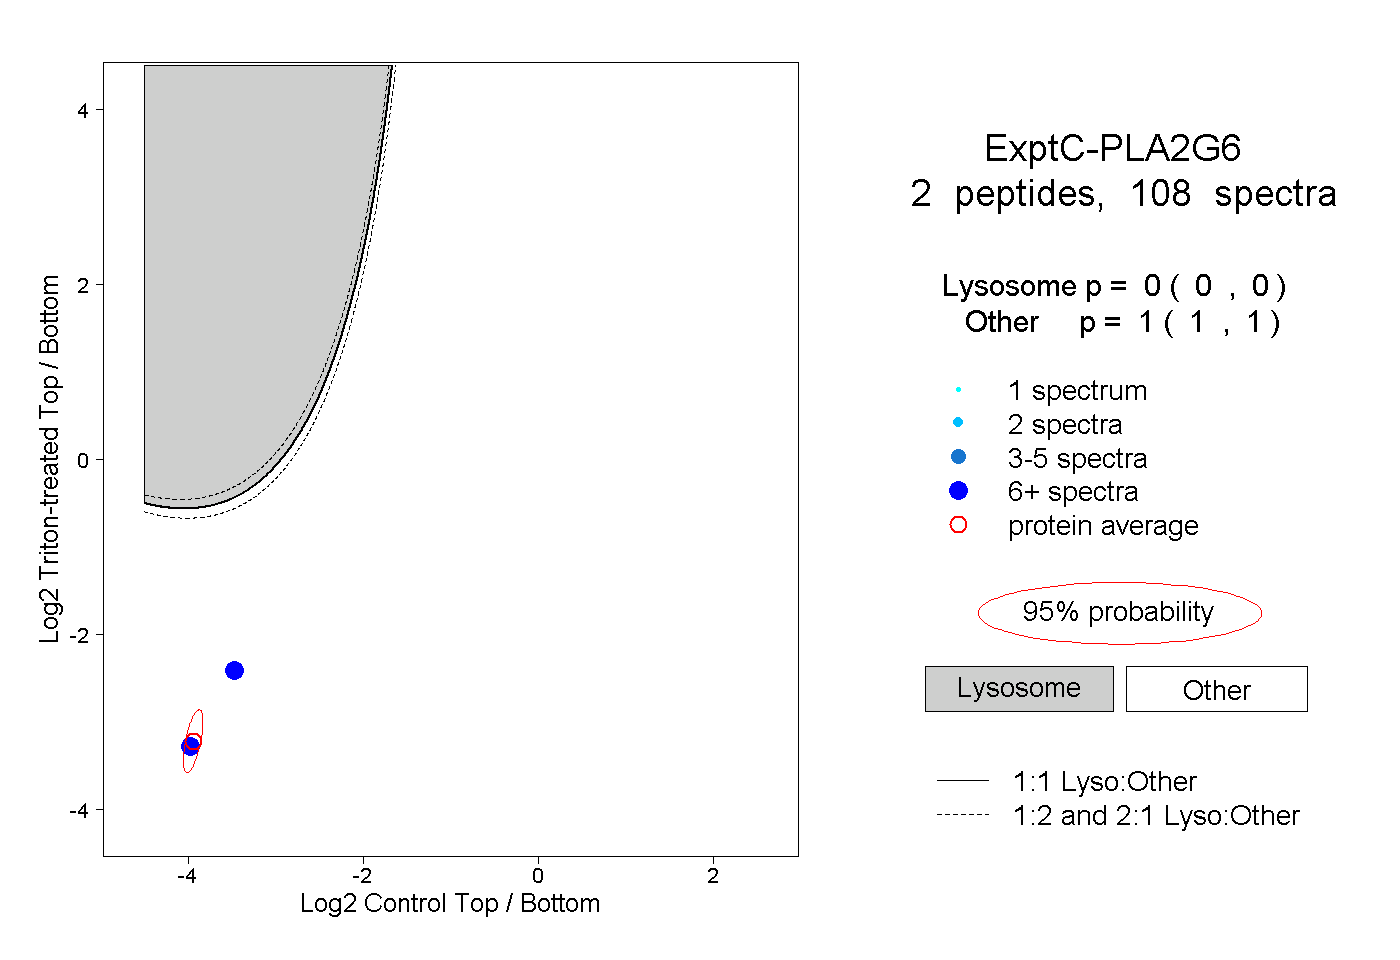
0.000 | 0.000
1.000 | 1.000
1peptide
spectra
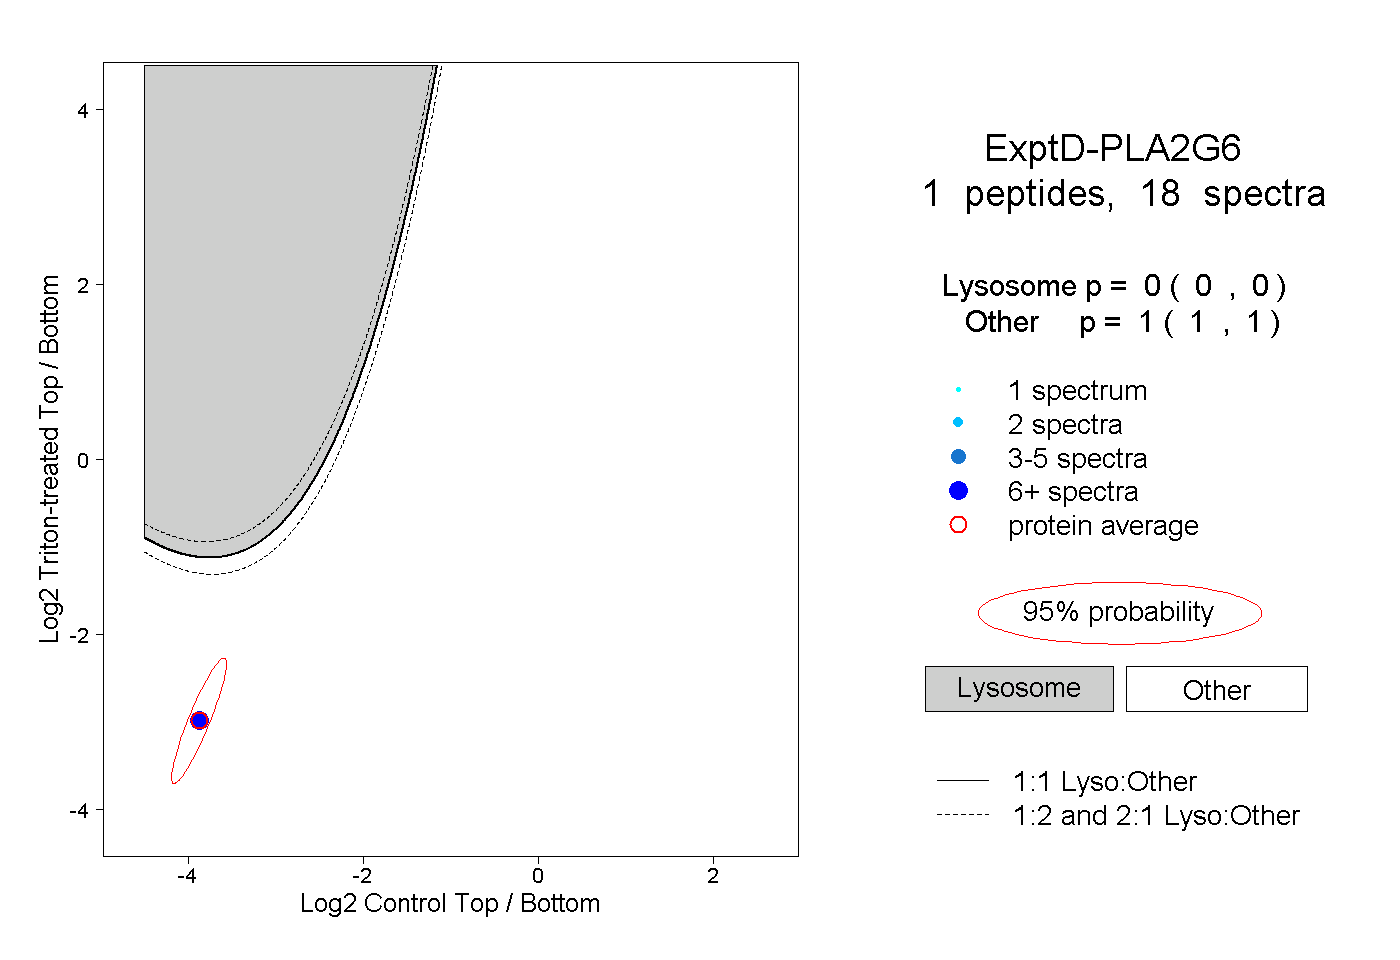
0.000 | 0.000
1.000 | 1.000