 6
6peptides
spectra
0.266 | 0.380
0.000 | 0.060
0.066 | 0.176
0.000 | 0.008
0.050 | 0.144
0.000 | 0.000
0.354 | 0.474
0.000 | 0.000
| Plot | Mito | Lyso | Perox | ER | Golgi | PM | Cytosol | Nucleus | |||||
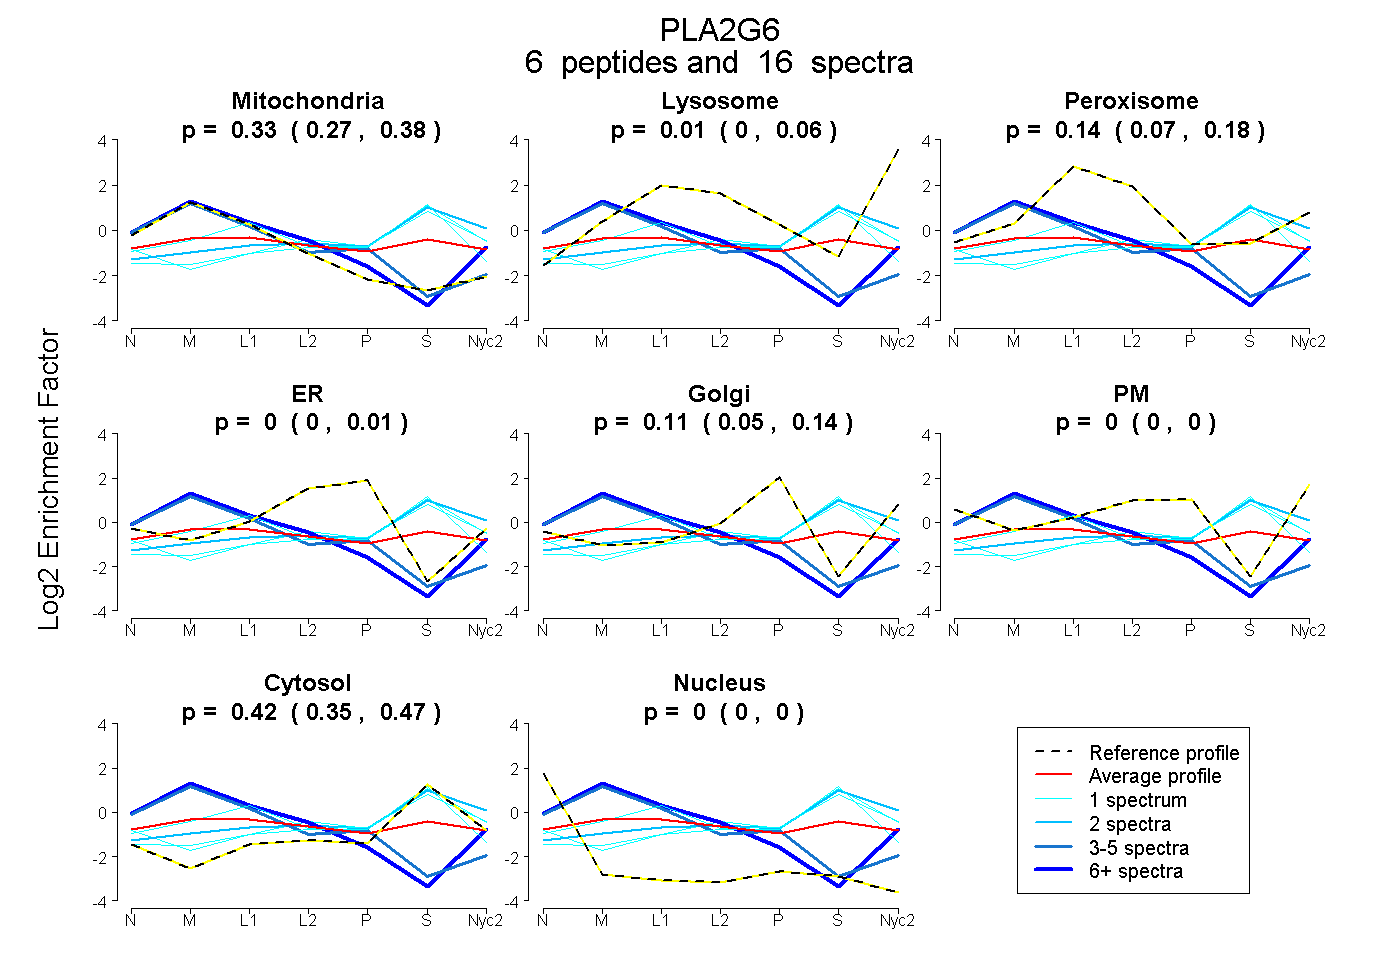
| Expt A |
6 peptides |
16 spectra |
|
0.326 0.266 | 0.380 |
0.006 0.000 | 0.060 |
0.142 0.066 | 0.176 |
0.000 0.000 | 0.008 |
0.109 0.050 | 0.144 |
0.000 0.000 | 0.000 |
0.417 0.354 | 0.474 |
0.000 0.000 | 0.000 |
| 3 spectra, TVFGAK | 0.800 | 0.000 | 0.000 | 0.115 | 0.085 | 0.000 | 0.000 | 0.000 | ||
| 2 spectra, KPAFILSSMR | 0.045 | 0.219 | 0.037 | 0.000 | 0.000 | 0.000 | 0.698 | 0.000 | ||
| 1 spectrum, VLLLCNAR | 0.066 | 0.000 | 0.057 | 0.065 | 0.000 | 0.000 | 0.811 | 0.000 | ||
| 8 spectra, QFFGR | 0.763 | 0.032 | 0.000 | 0.000 | 0.000 | 0.205 | 0.000 | 0.000 | ||
| 1 spectrum, EFGEHTK | 0.000 | 0.000 | 0.108 | 0.047 | 0.000 | 0.074 | 0.771 | 0.000 | ||
| 1 spectrum, VMLTGTLSDR | 0.117 | 0.015 | 0.324 | 0.000 | 0.000 | 0.000 | 0.544 | 0.000 |
| Plot | Mito | Lyso or Perox | ER | Golgi | PM | Cytosol | Nucleus | ||||||
| Expt B |
4 peptides |
6 spectra |
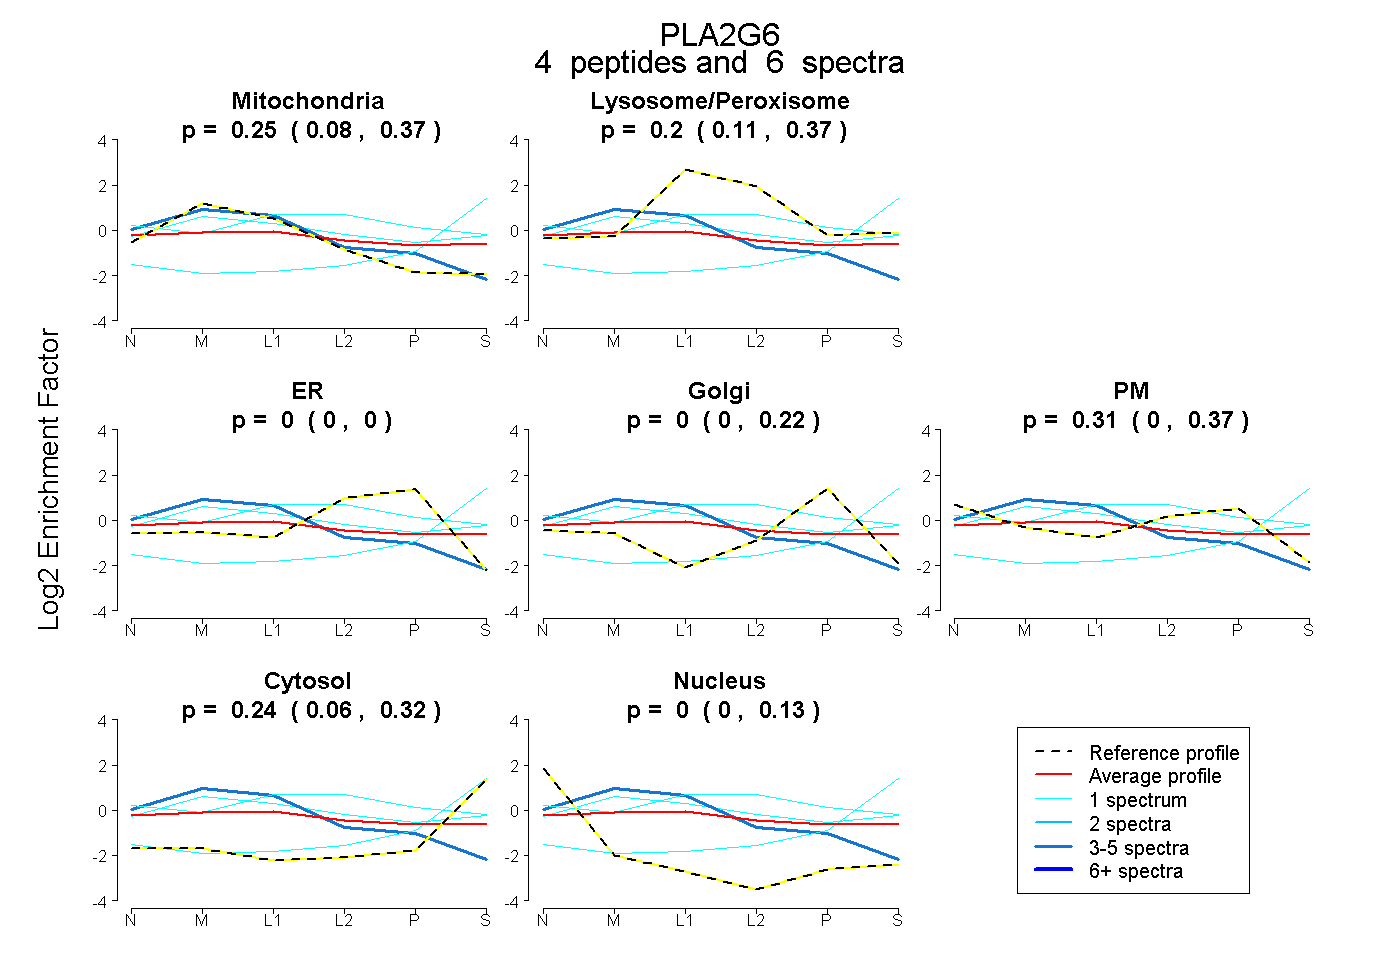 |
0.251 0.075 | 0.373 |
0.197 0.109 | 0.373 |
0.000 0.000 | 0.003 |
0.000 0.000 | 0.218 |
0.310 0.000 | 0.366 |
0.242 0.064 | 0.318 |
0.000 0.000 | 0.135 |
|||
| Plot | Lyso | Other | |||||||||||
| Expt C |
2 peptides |
108 spectra |
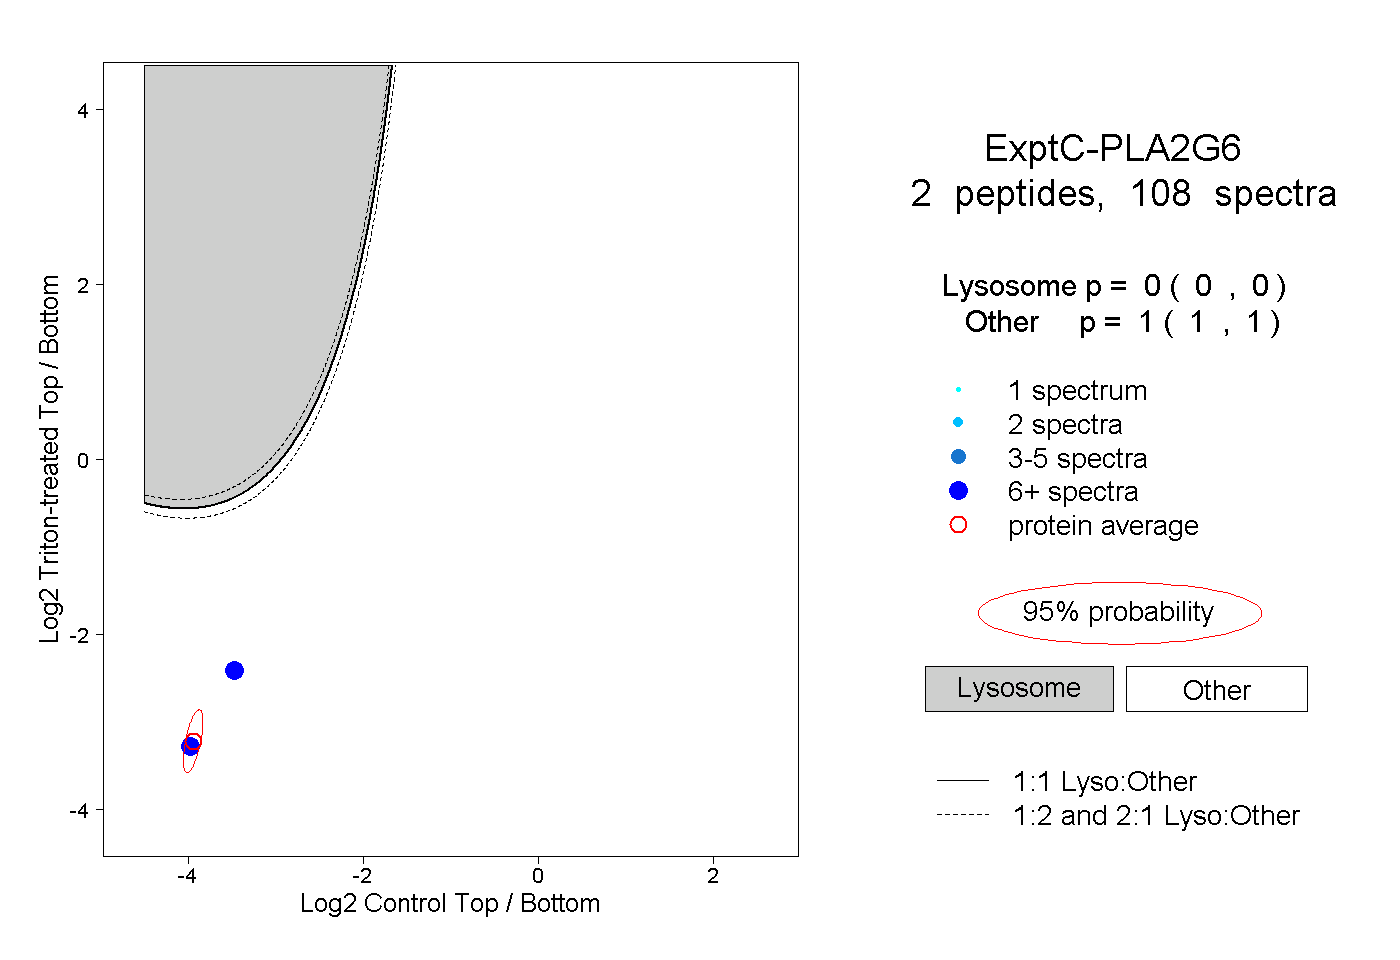 |
0.000 0.000 | 0.000 |
1.000 1.000 | 1.000 |
||||||||
| Plot | Lyso | Other | |||||||||||
| Expt D |
1 peptide |
18 spectra |
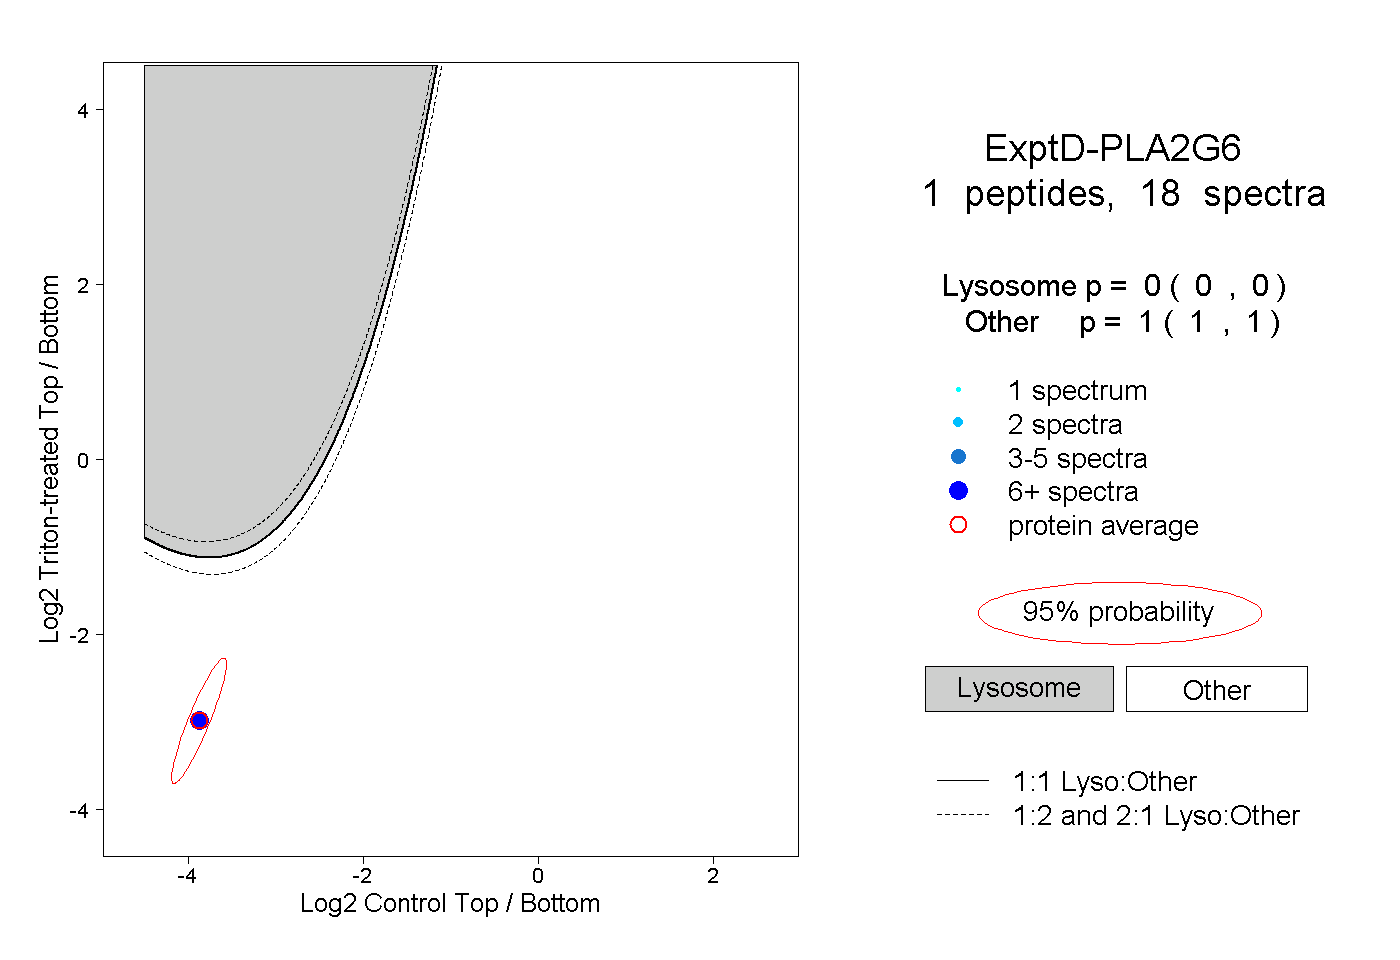 |
0.000 0.000 | 0.000 |
1.000 1.000 | 1.000 |