 10
10peptides
spectra
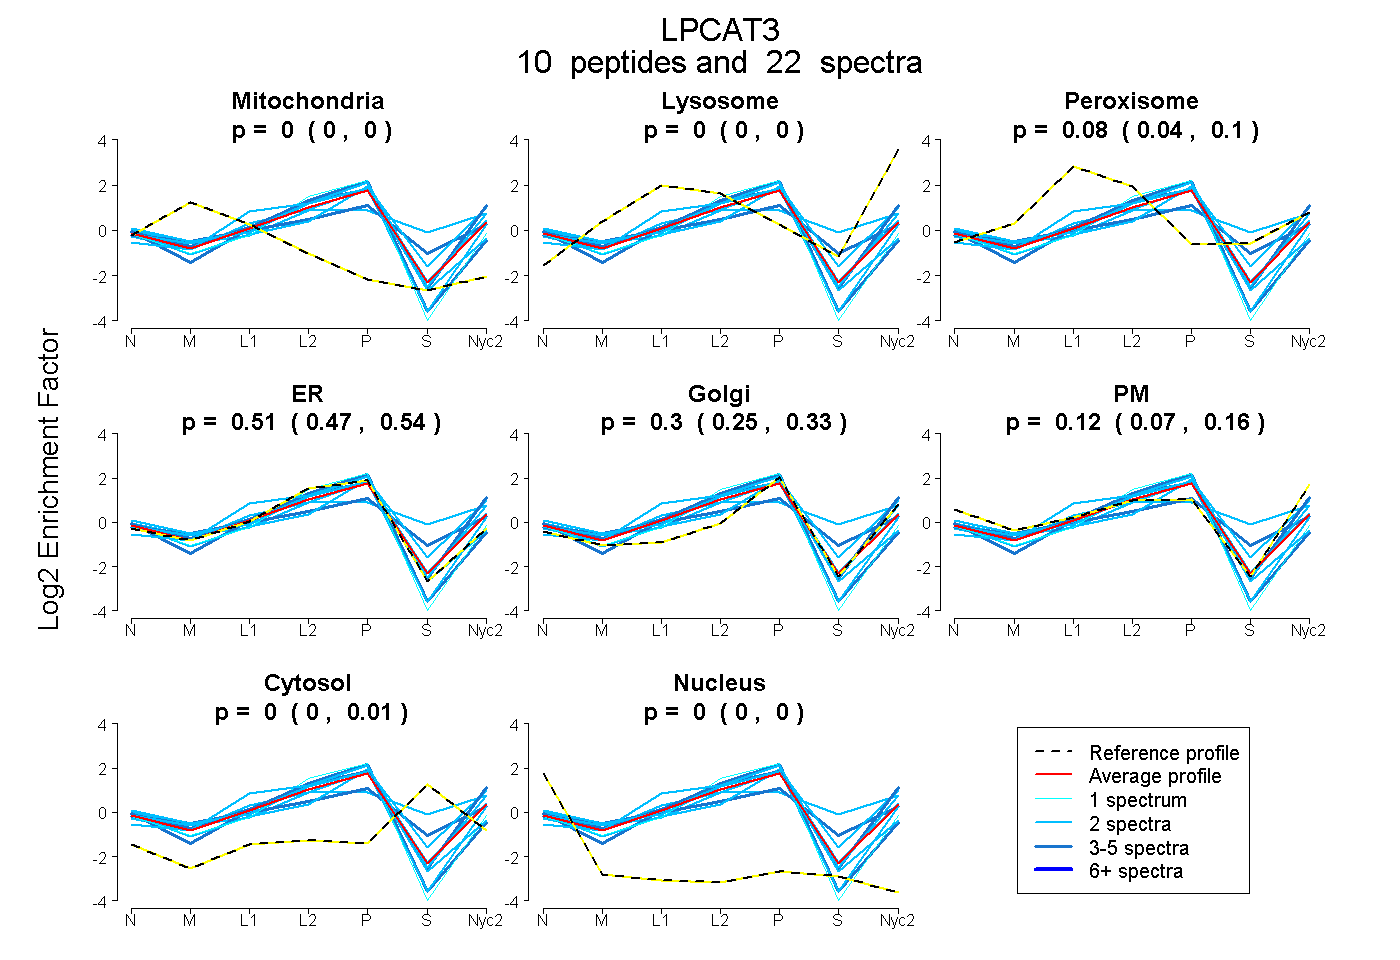
0.000 | 0.000
0.000 | 0.003
0.044 | 0.100
0.465 | 0.544
0.249 | 0.334
0.074 | 0.156
0.000 | 0.007
0.000 | 0.000
2peptides
spectra
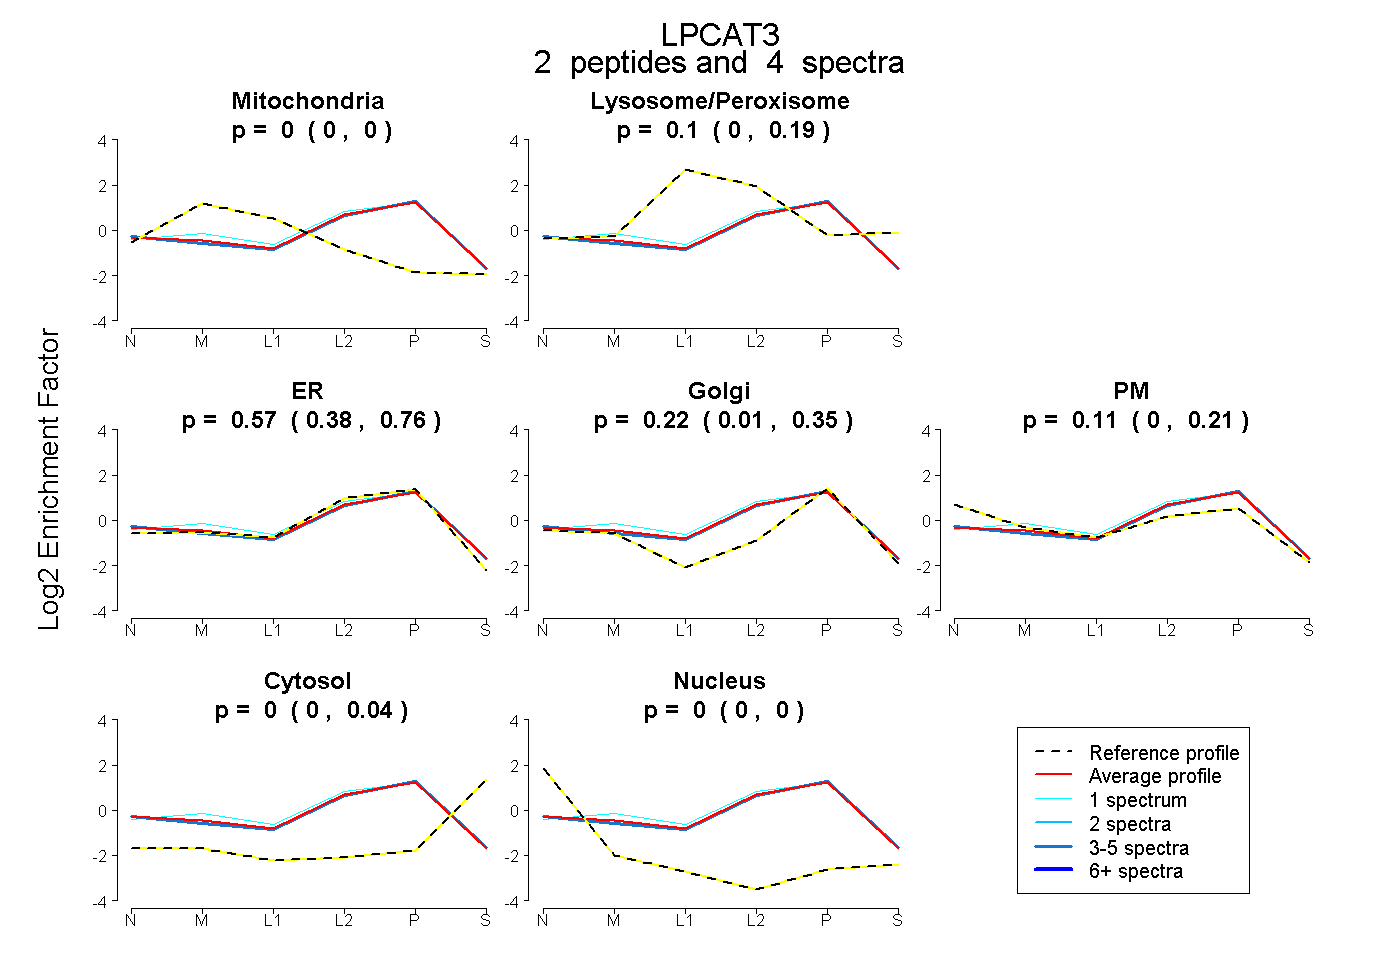
0.000 | 0.000
0.000 | 0.192
0.384 | 0.759
0.015 | 0.354
0.000 | 0.208
0.000 | 0.042
0.000 | 0.000
7peptides
spectra
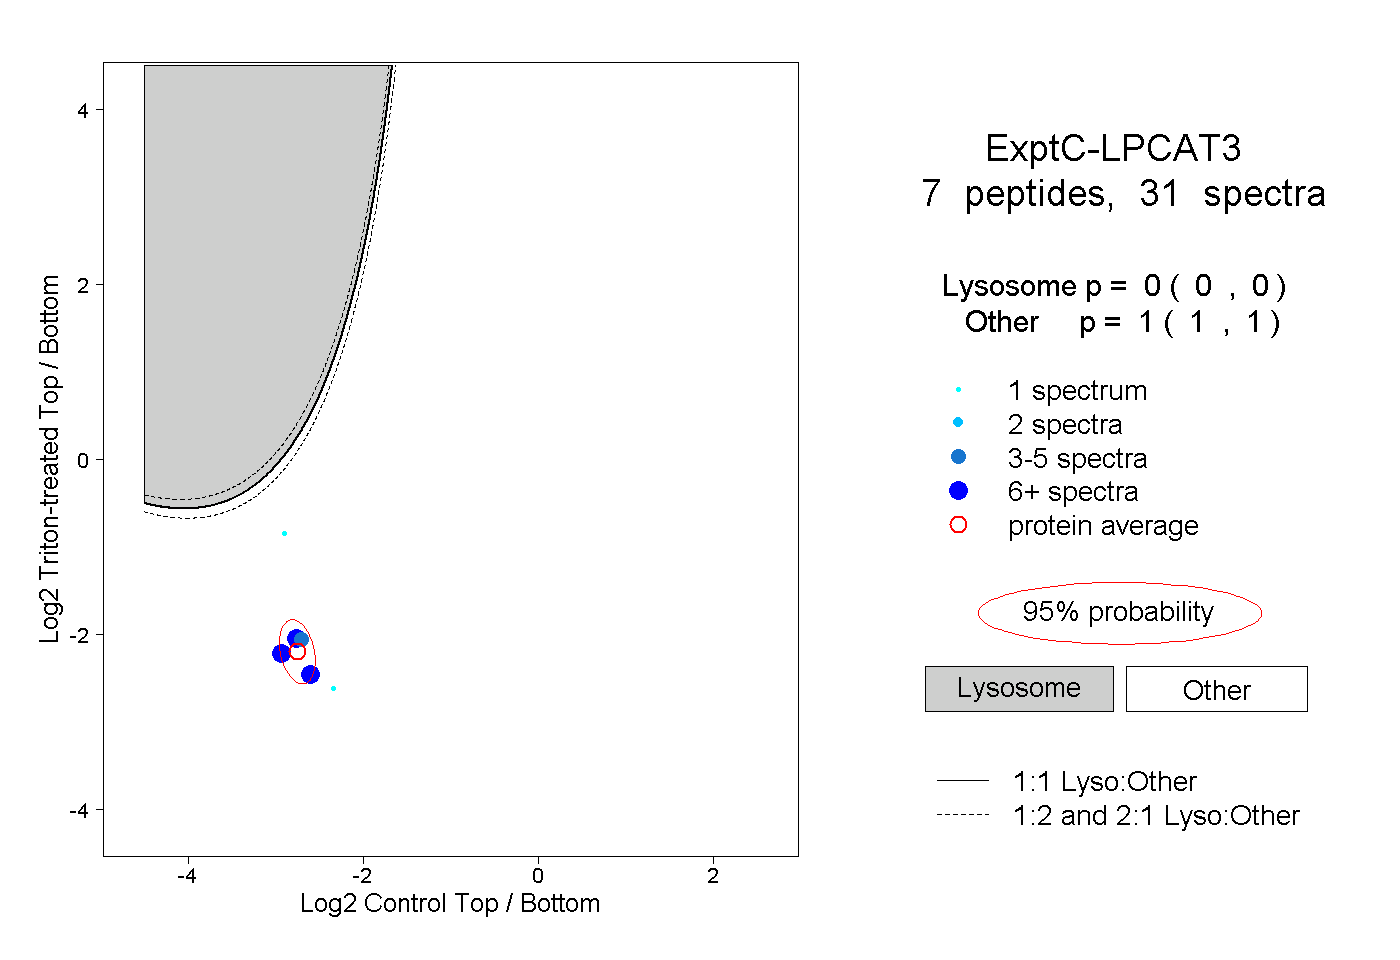
0.000 | 0.000
1.000 | 1.000
6peptides
spectra
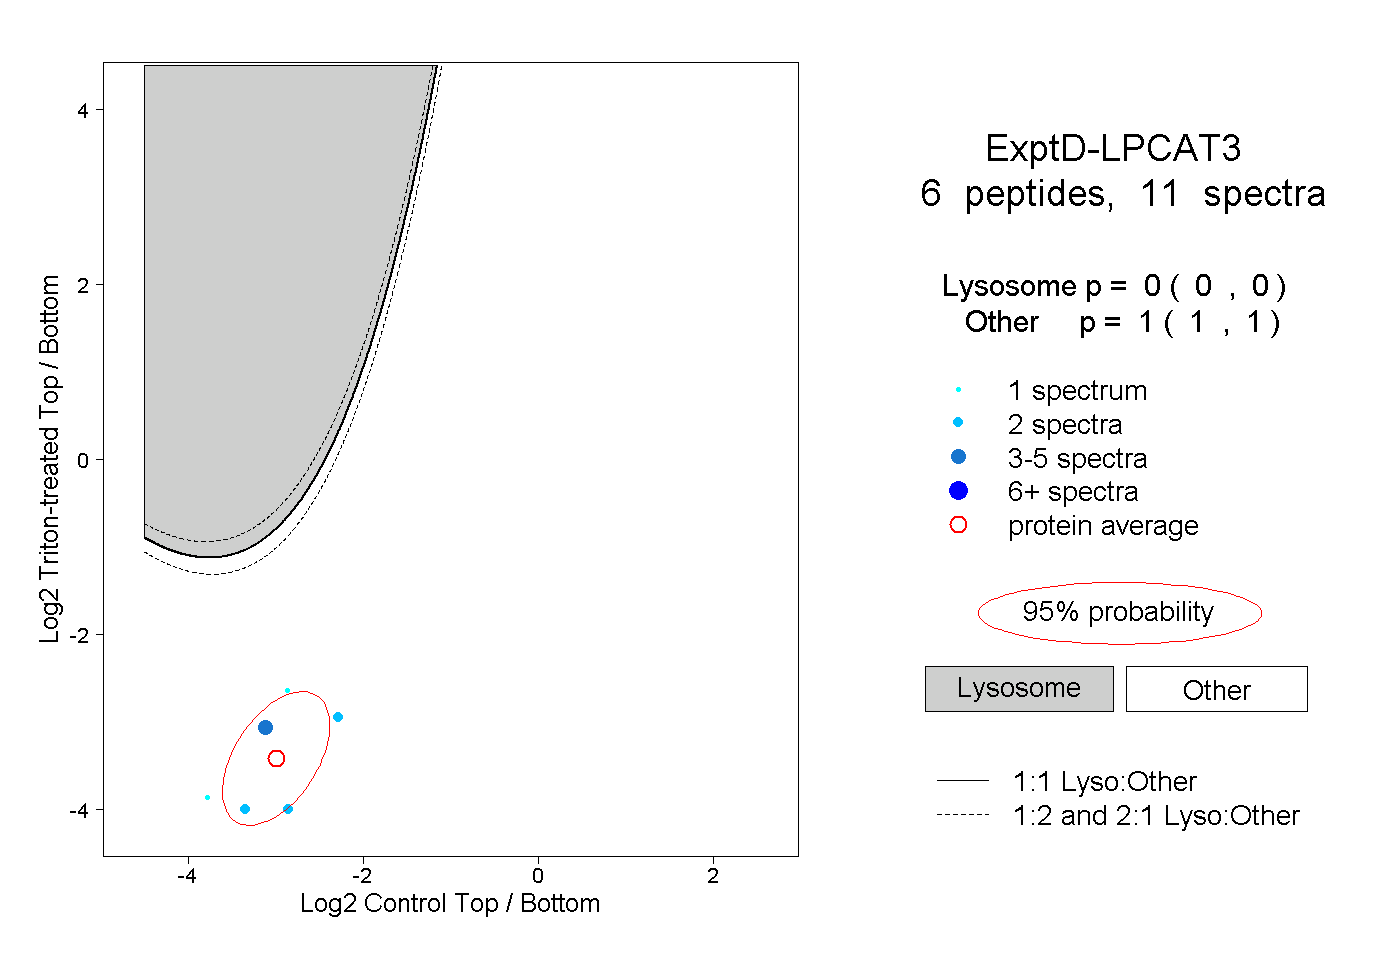
0.000 | 0.000
1.000 | 1.000