 10
10peptides
spectra
0.000 | 0.000
0.000 | 0.003
0.044 | 0.100
0.465 | 0.544
0.249 | 0.334
0.074 | 0.156
0.000 | 0.007
0.000 | 0.000
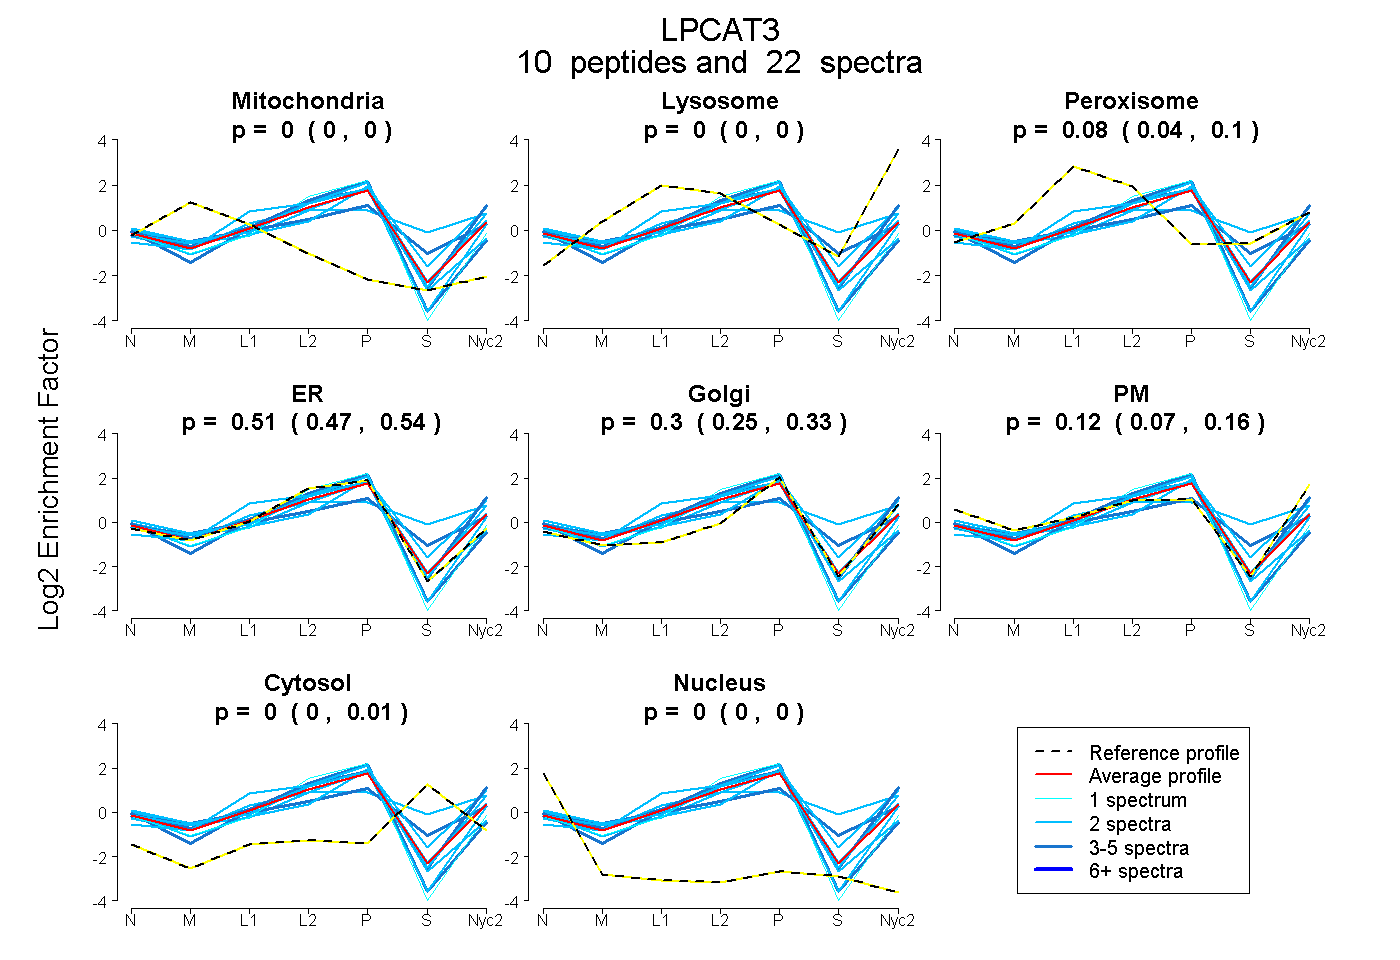
| Plot | Mito | Lyso | Perox | ER | Golgi | PM | Cytosol | Nucleus | |||||
| Expt A |
10 peptides |
22 spectra |
|
0.000 0.000 | 0.000 |
0.000 0.000 | 0.003 |
0.077 0.044 | 0.100 |
0.507 0.465 | 0.544 |
0.301 0.249 | 0.334 |
0.116 0.074 | 0.156 |
0.000 0.000 | 0.007 |
0.000 0.000 | 0.000 |
| 3 spectra, VWLFETTPR | 0.000 | 0.082 | 0.000 | 0.409 | 0.163 | 0.346 | 0.000 | 0.000 | ||
| 2 spectra, LATSLGASEQALR | 0.000 | 0.000 | 0.000 | 0.705 | 0.071 | 0.218 | 0.000 | 0.006 | ||
| 1 spectrum, NSLSSEQQK | 0.000 | 0.000 | 0.000 | 0.940 | 0.060 | 0.000 | 0.000 | 0.000 | ||
| 2 spectra, WDACANMK | 0.000 | 0.205 | 0.000 | 0.672 | 0.123 | 0.000 | 0.000 | 0.000 | ||
| 2 spectra, ASTADGDVGETLGQMR | 0.000 | 0.075 | 0.102 | 0.153 | 0.000 | 0.373 | 0.297 | 0.000 | ||
| 2 spectra, AMVPR | 0.000 | 0.022 | 0.110 | 0.475 | 0.364 | 0.030 | 0.000 | 0.000 | ||
| 2 spectra, WTMPHCVLTLK | 0.054 | 0.000 | 0.000 | 0.867 | 0.079 | 0.000 | 0.000 | 0.000 | ||
| 3 spectra, GQLTDVPGK | 0.003 | 0.000 | 0.249 | 0.150 | 0.424 | 0.024 | 0.150 | 0.000 | ||
| 2 spectra, HYLFYK | 0.000 | 0.014 | 0.124 | 0.000 | 0.743 | 0.089 | 0.031 | 0.000 | ||
| 3 spectra, GLWPGVEDLSLNK | 0.000 | 0.000 | 0.000 | 0.968 | 0.000 | 0.000 | 0.000 | 0.032 |
| Plot | Mito | Lyso or Perox | ER | Golgi | PM | Cytosol | Nucleus | ||||||
| Expt B |
2 peptides |
4 spectra |
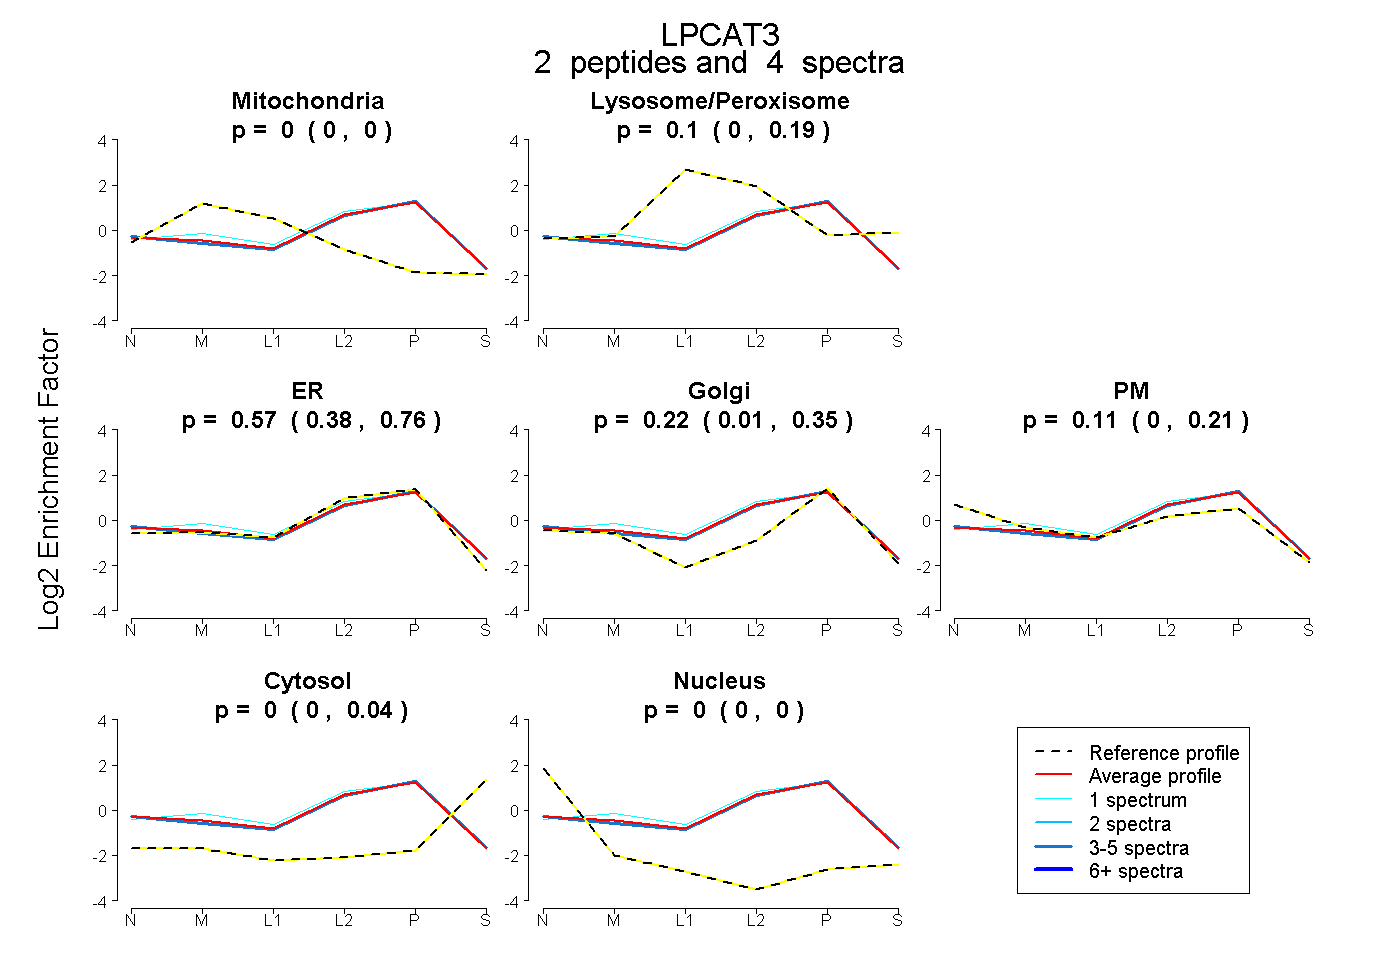 |
0.000 0.000 | 0.000 |
0.104 0.000 | 0.192 |
0.570 0.384 | 0.759 |
0.219 0.015 | 0.354 |
0.107 0.000 | 0.208 |
0.000 0.000 | 0.042 |
0.000 0.000 | 0.000 |
|||
| Plot | Lyso | Other | |||||||||||
| Expt C |
7 peptides |
31 spectra |
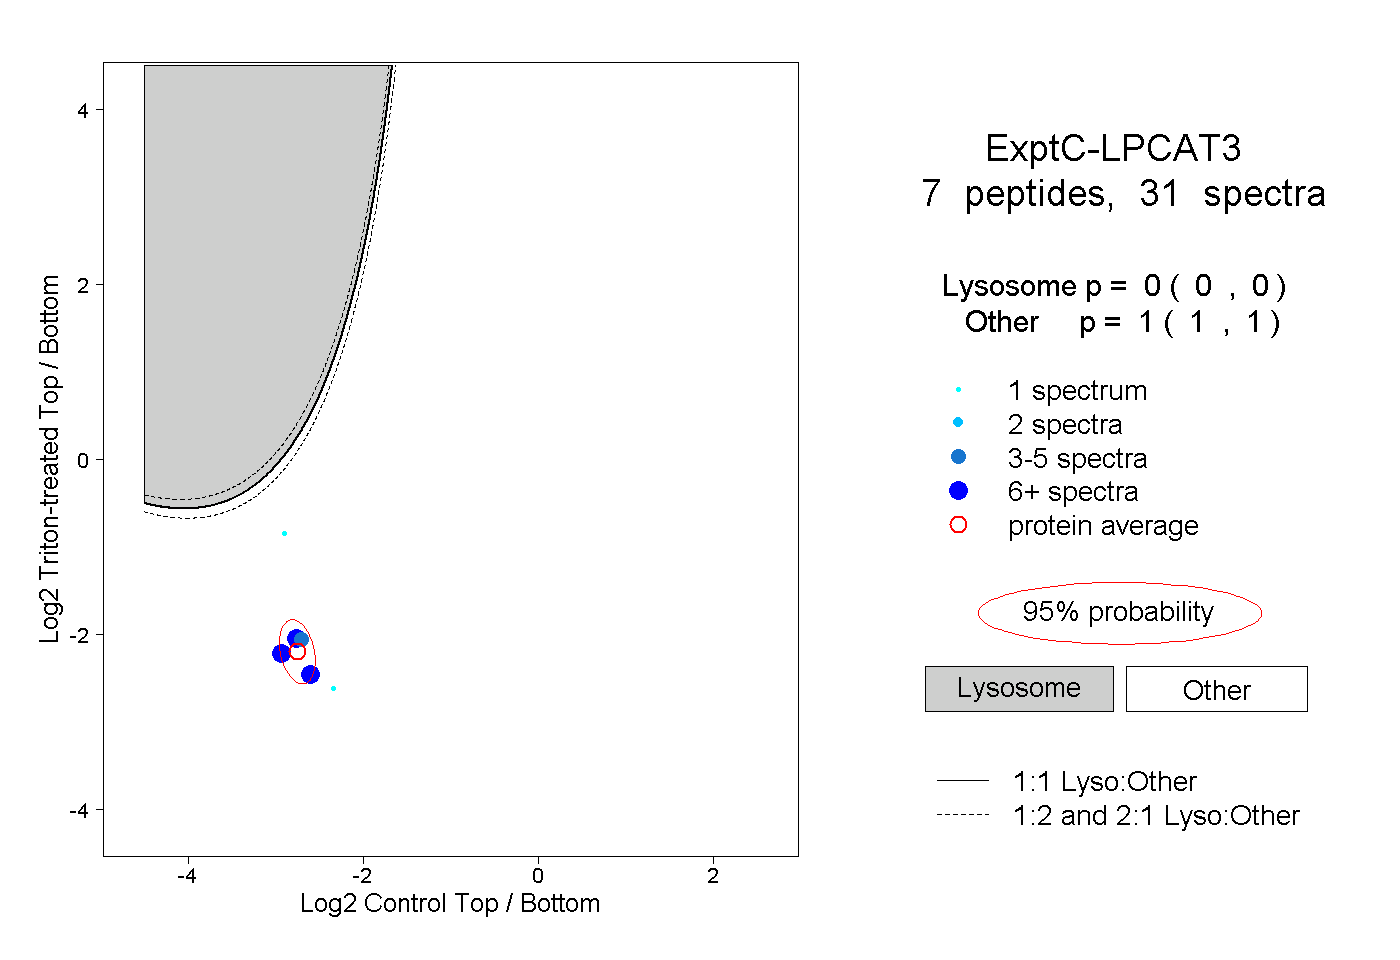 |
0.000 0.000 | 0.000 |
1.000 1.000 | 1.000 |
||||||||
| Plot | Lyso | Other | |||||||||||
| Expt D |
6 peptides |
11 spectra |
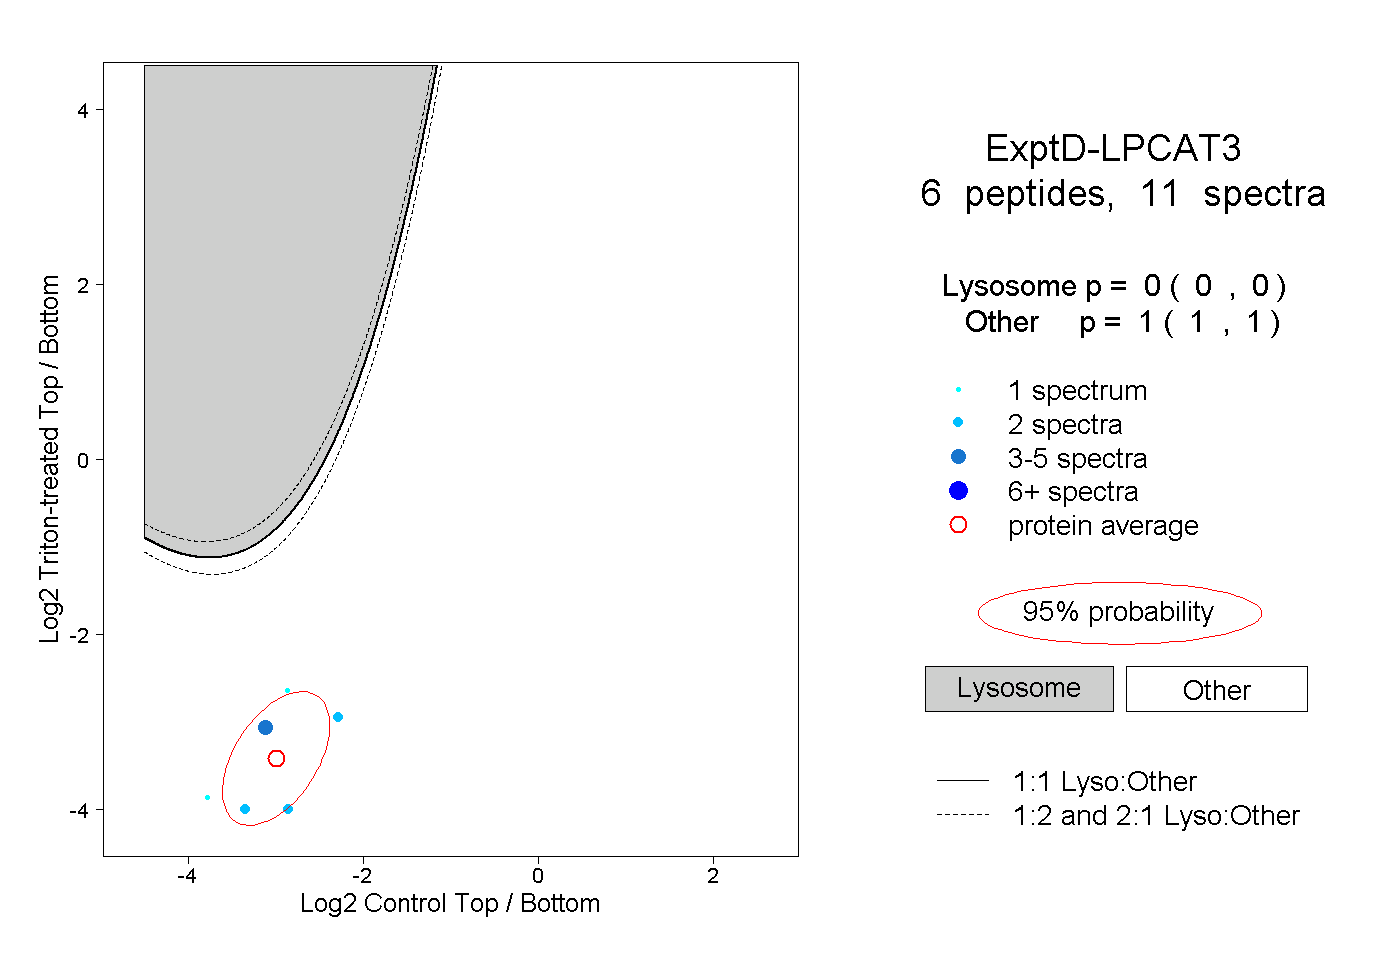 |
0.000 0.000 | 0.000 |
1.000 1.000 | 1.000 |