 5
5peptides
spectra
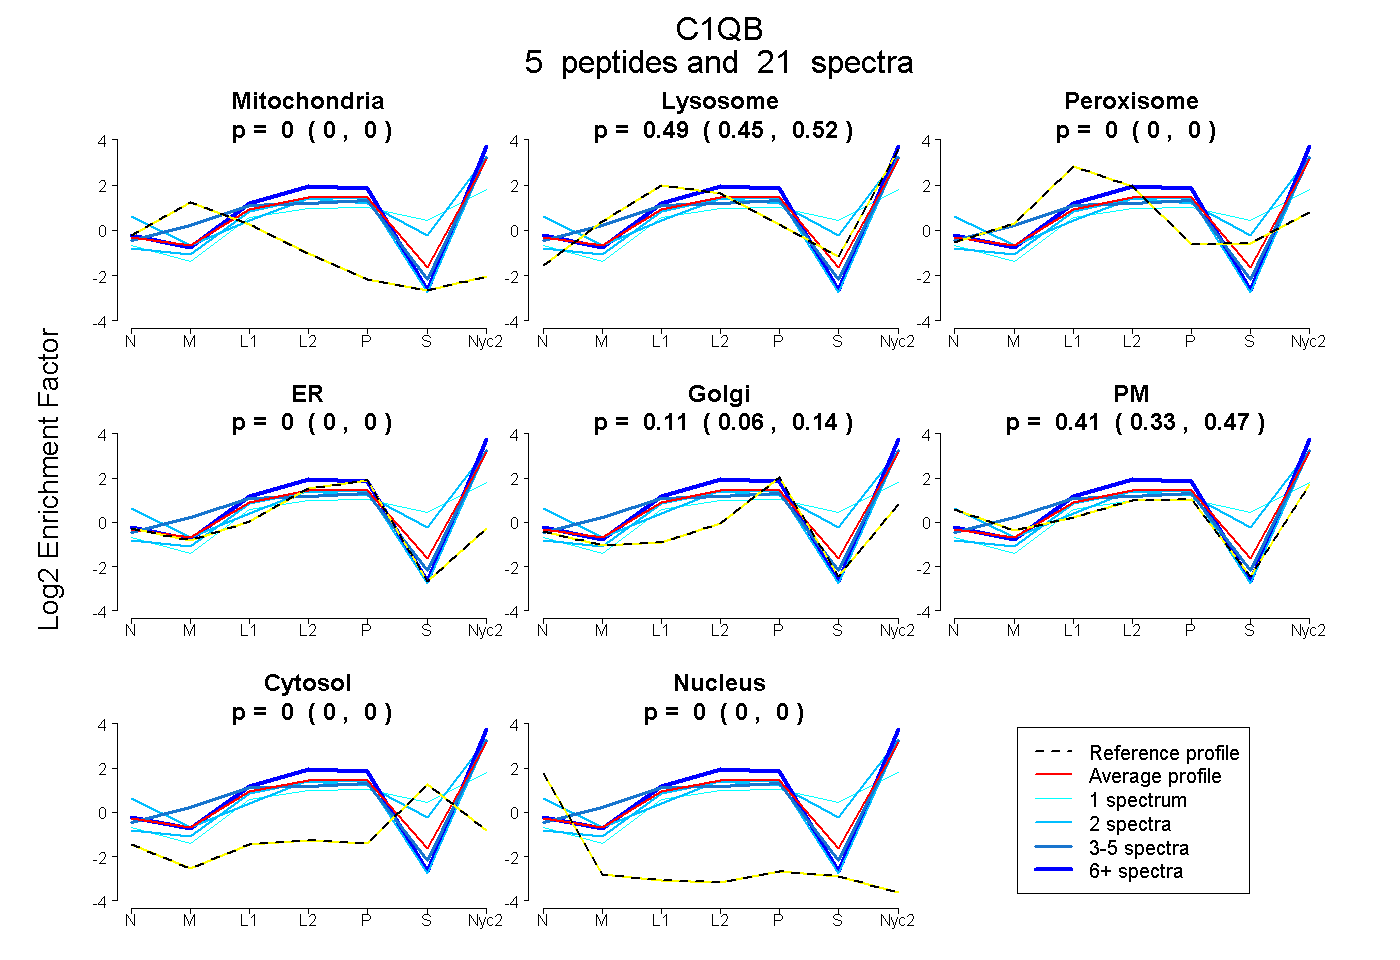
0.000 | 0.000
0.446 | 0.519
0.000 | 0.000
0.000 | 0.000
0.059 | 0.145
0.333 | 0.472
0.000 | 0.000
0.000 | 0.000
2peptides
spectra
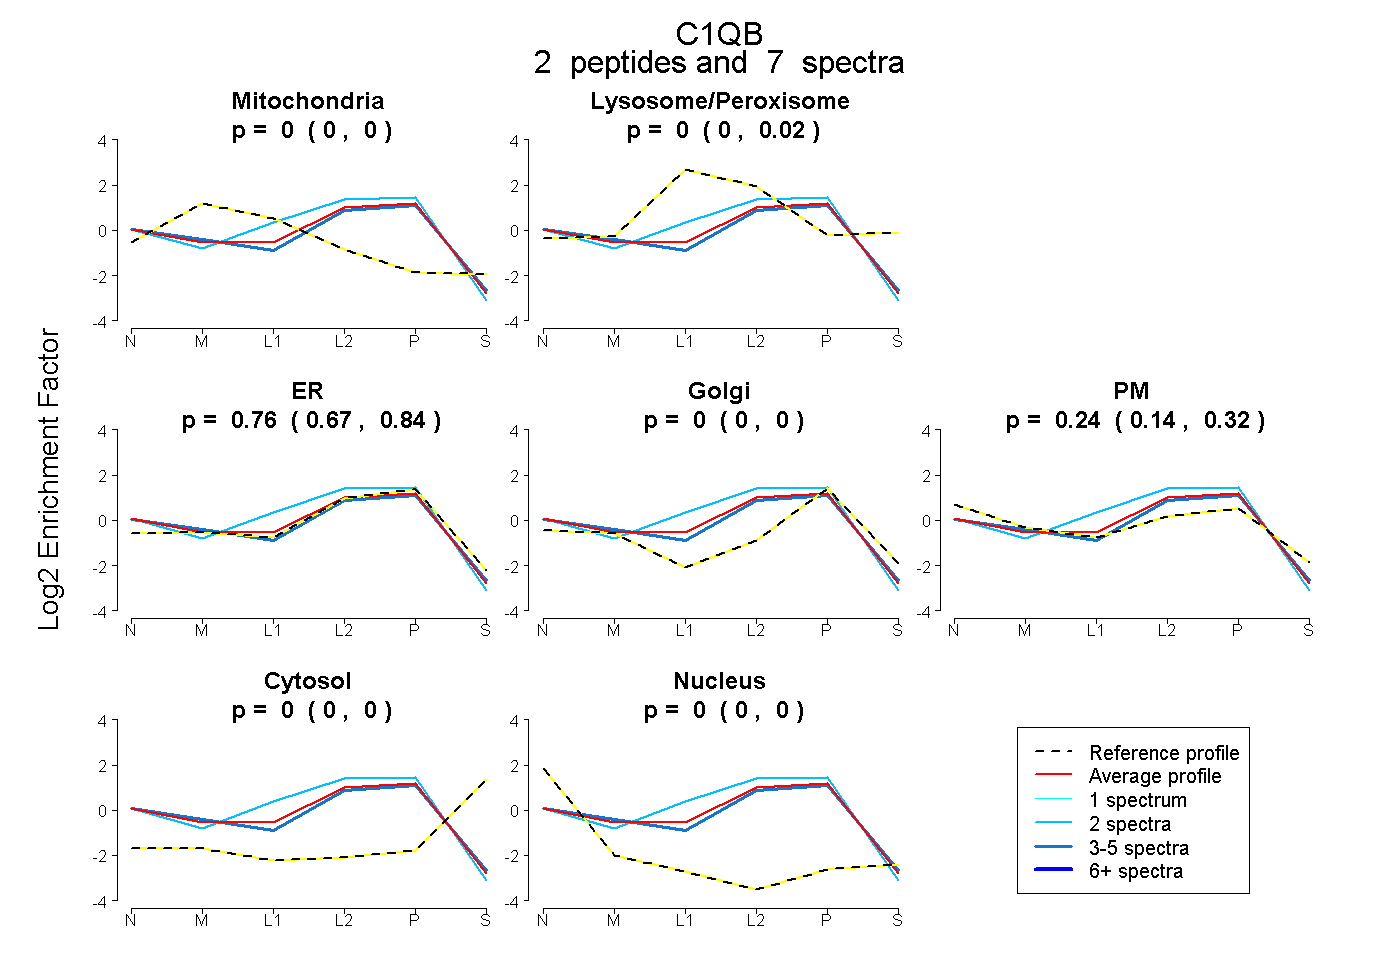
0.000 | 0.004
0.000 | 0.018
0.666 | 0.837
0.000 | 0.000
0.138 | 0.317
0.000 | 0.000
0.000 | 0.000
6peptides
spectra
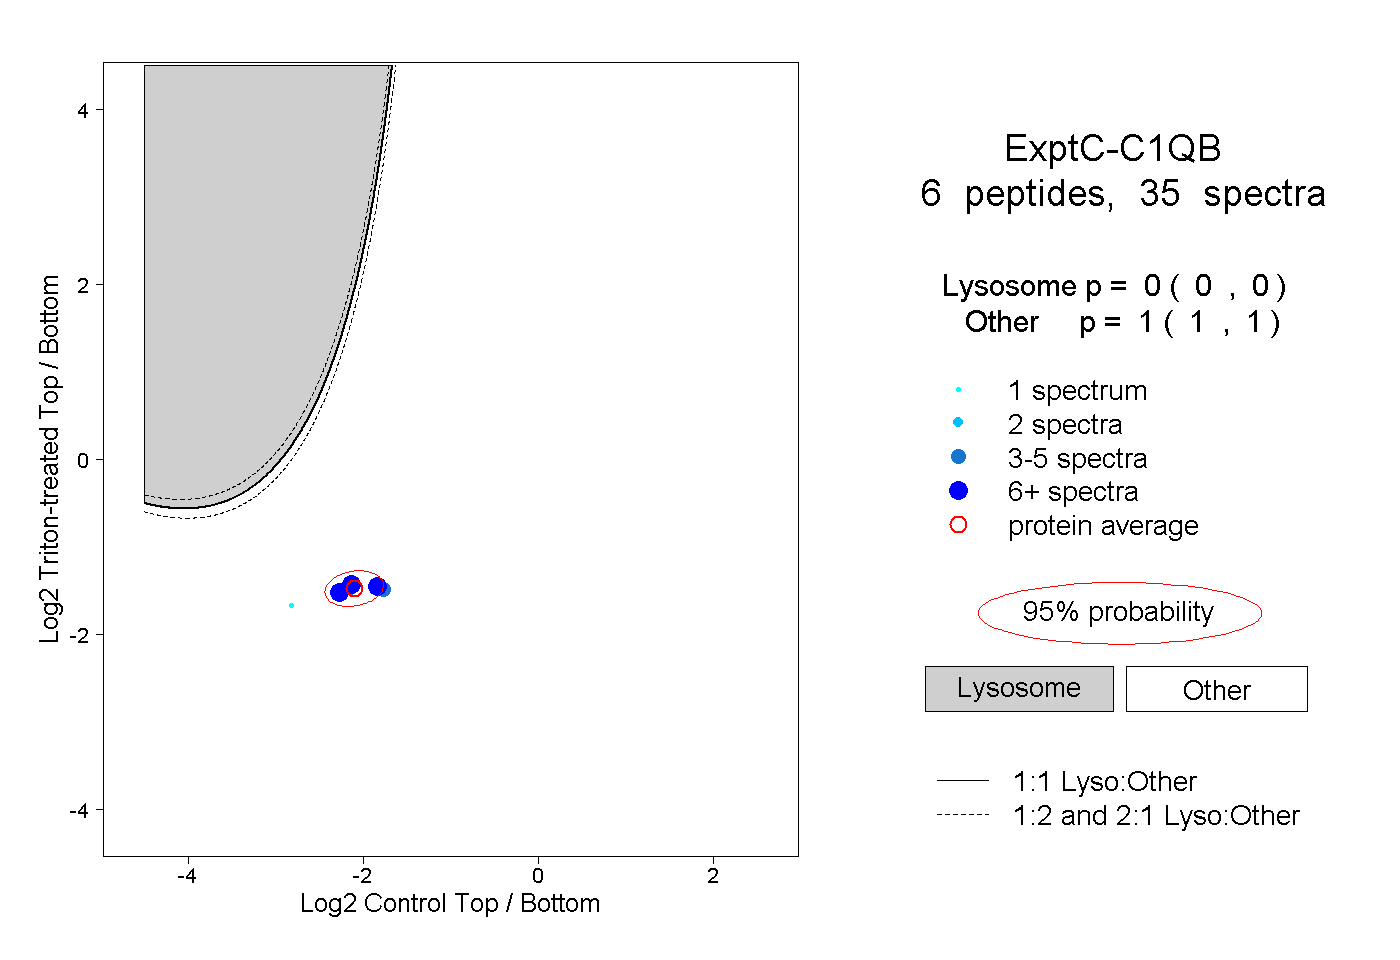
0.000 | 0.000
1.000 | 1.000
4peptides
spectra
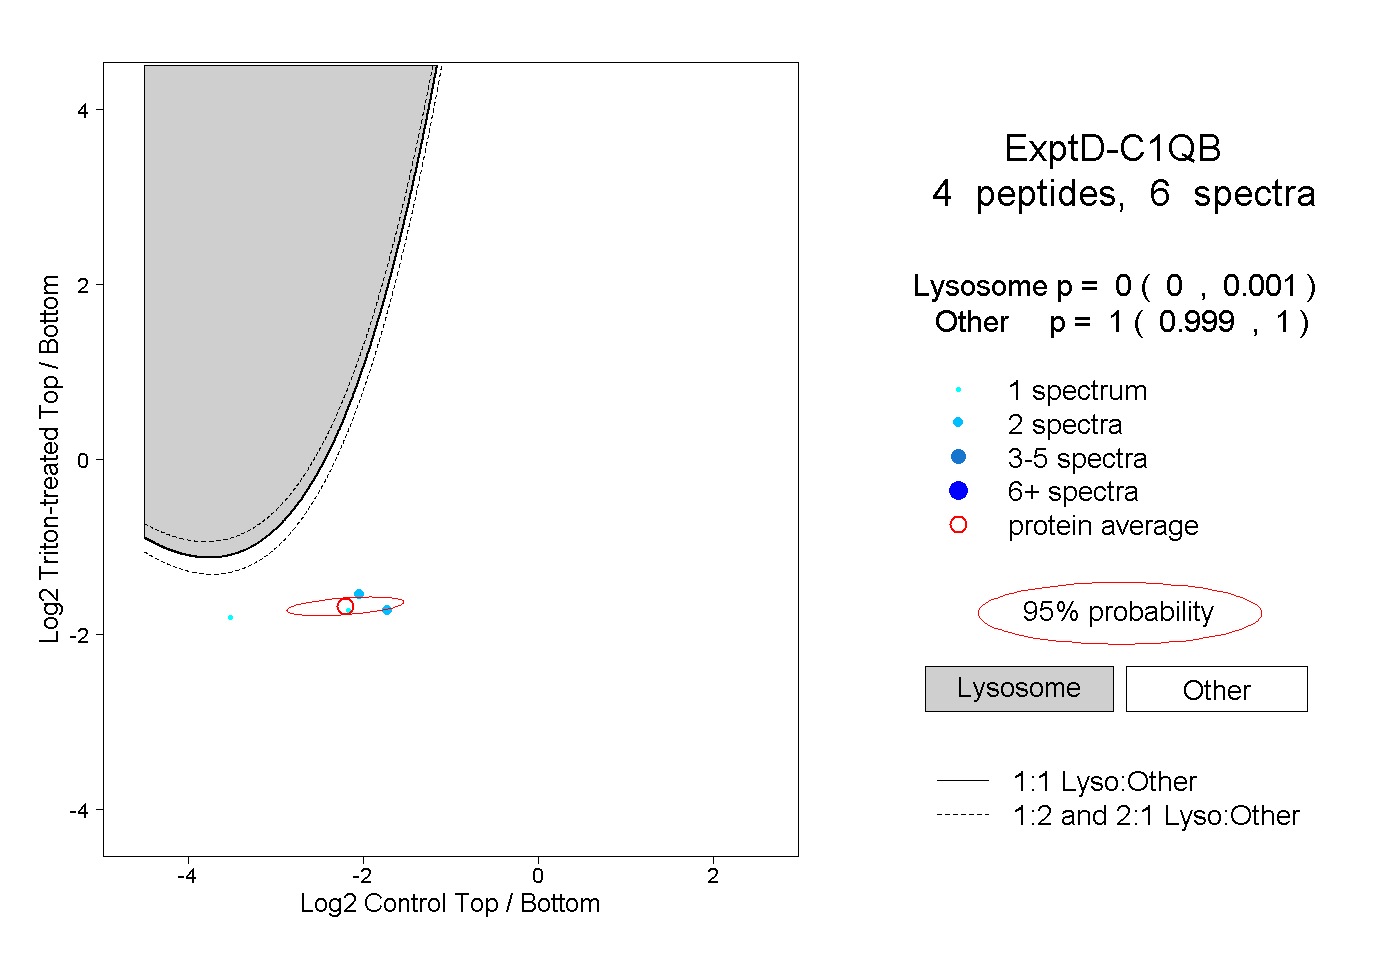
0.000 | 0.001
0.999 | 1.000