 5
5peptides
spectra
0.000 | 0.000
0.446 | 0.519
0.000 | 0.000
0.000 | 0.000
0.059 | 0.145
0.333 | 0.472
0.000 | 0.000
0.000 | 0.000
| Plot | Mito | Lyso | Perox | ER | Golgi | PM | Cytosol | Nucleus | |||||
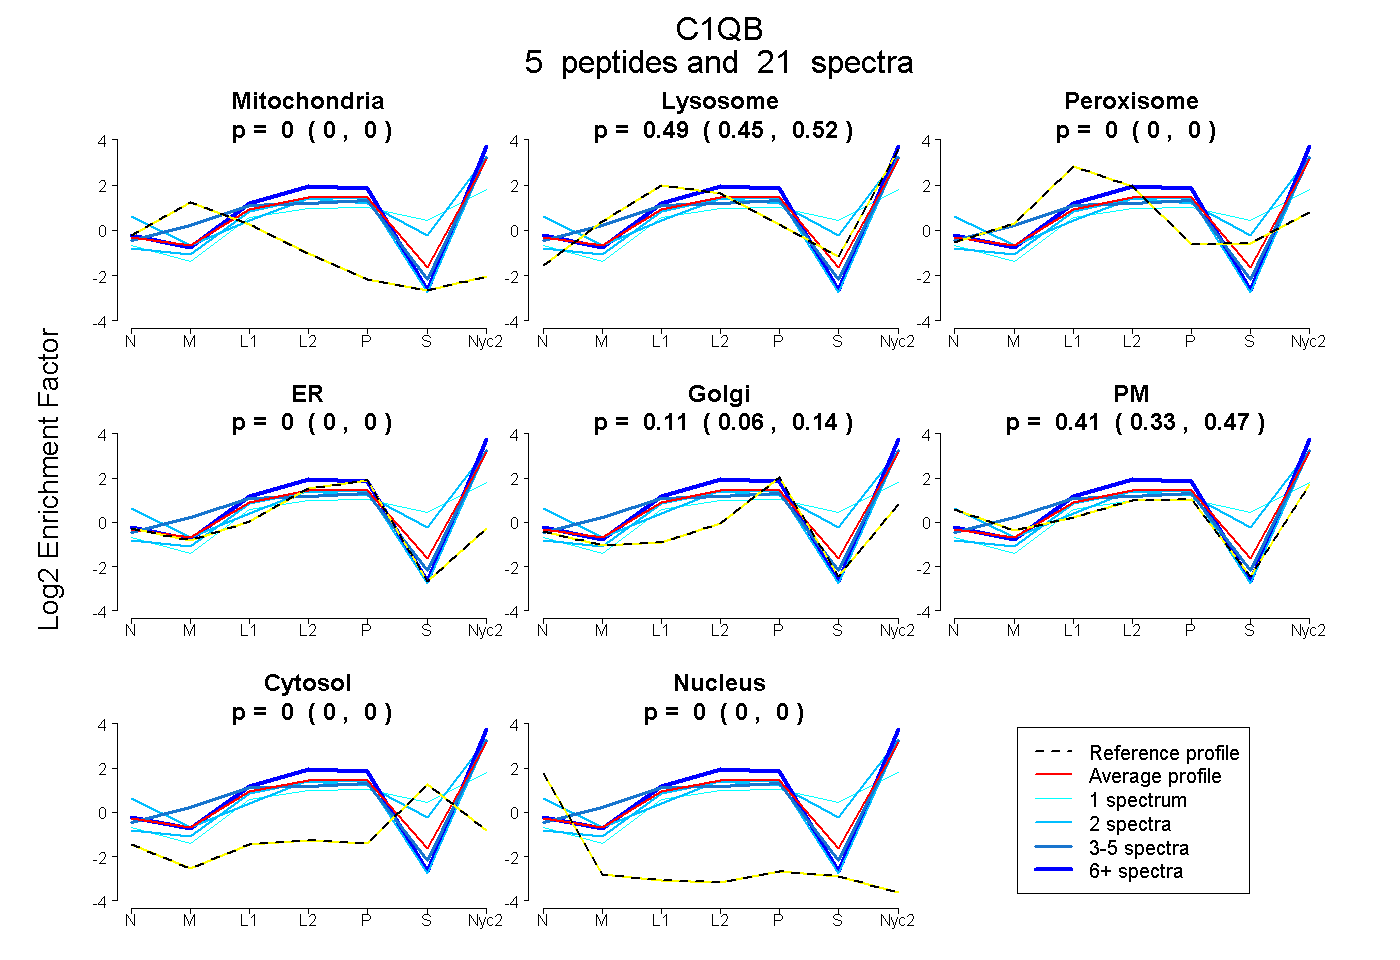
| Expt A |
5 peptides |
21 spectra |
|
0.000 0.000 | 0.000 |
0.486 0.446 | 0.519 |
0.000 0.000 | 0.000 |
0.000 0.000 | 0.000 |
0.107 0.059 | 0.145 |
0.407 0.333 | 0.472 |
0.000 0.000 | 0.000 |
0.000 0.000 | 0.000 |
| 12 spectra, TVNSALRPNQAIR | 0.000 | 0.458 | 0.000 | 0.000 | 0.000 | 0.542 | 0.000 | 0.000 | ||
| 4 spectra, VITNVNDNYEPR | 0.000 | 0.510 | 0.000 | 0.000 | 0.012 | 0.478 | 0.000 | 0.000 | ||
| 2 spectra, LEQEEVVHLQATDK | 0.000 | 0.699 | 0.000 | 0.000 | 0.194 | 0.000 | 0.107 | 0.000 | ||
| 2 spectra, VAFSAIR | 0.000 | 0.175 | 0.000 | 0.000 | 0.000 | 0.825 | 0.000 | 0.000 | ||
| 1 spectrum, GNLCVNIVR | 0.000 | 0.486 | 0.000 | 0.107 | 0.072 | 0.017 | 0.318 | 0.000 |
| Plot | Mito | Lyso or Perox | ER | Golgi | PM | Cytosol | Nucleus | ||||||
| Expt B |
2 peptides |
7 spectra |
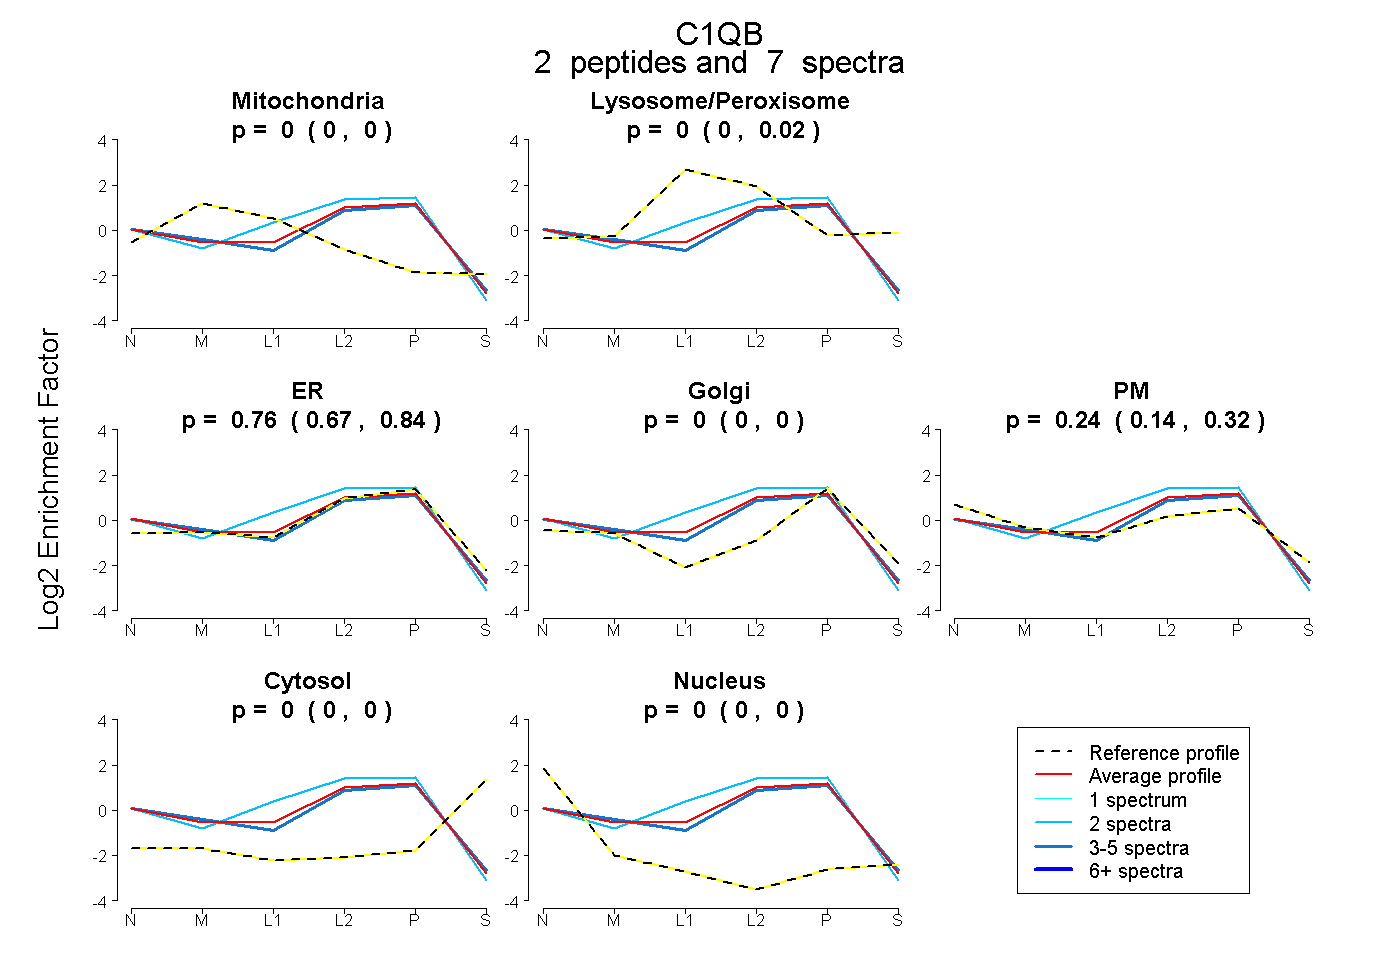 |
0.000 0.000 | 0.004 |
0.000 0.000 | 0.018 |
0.761 0.666 | 0.837 |
0.000 0.000 | 0.000 |
0.239 0.138 | 0.317 |
0.000 0.000 | 0.000 |
0.000 0.000 | 0.000 |
|||
| Plot | Lyso | Other | |||||||||||
| Expt C |
6 peptides |
35 spectra |
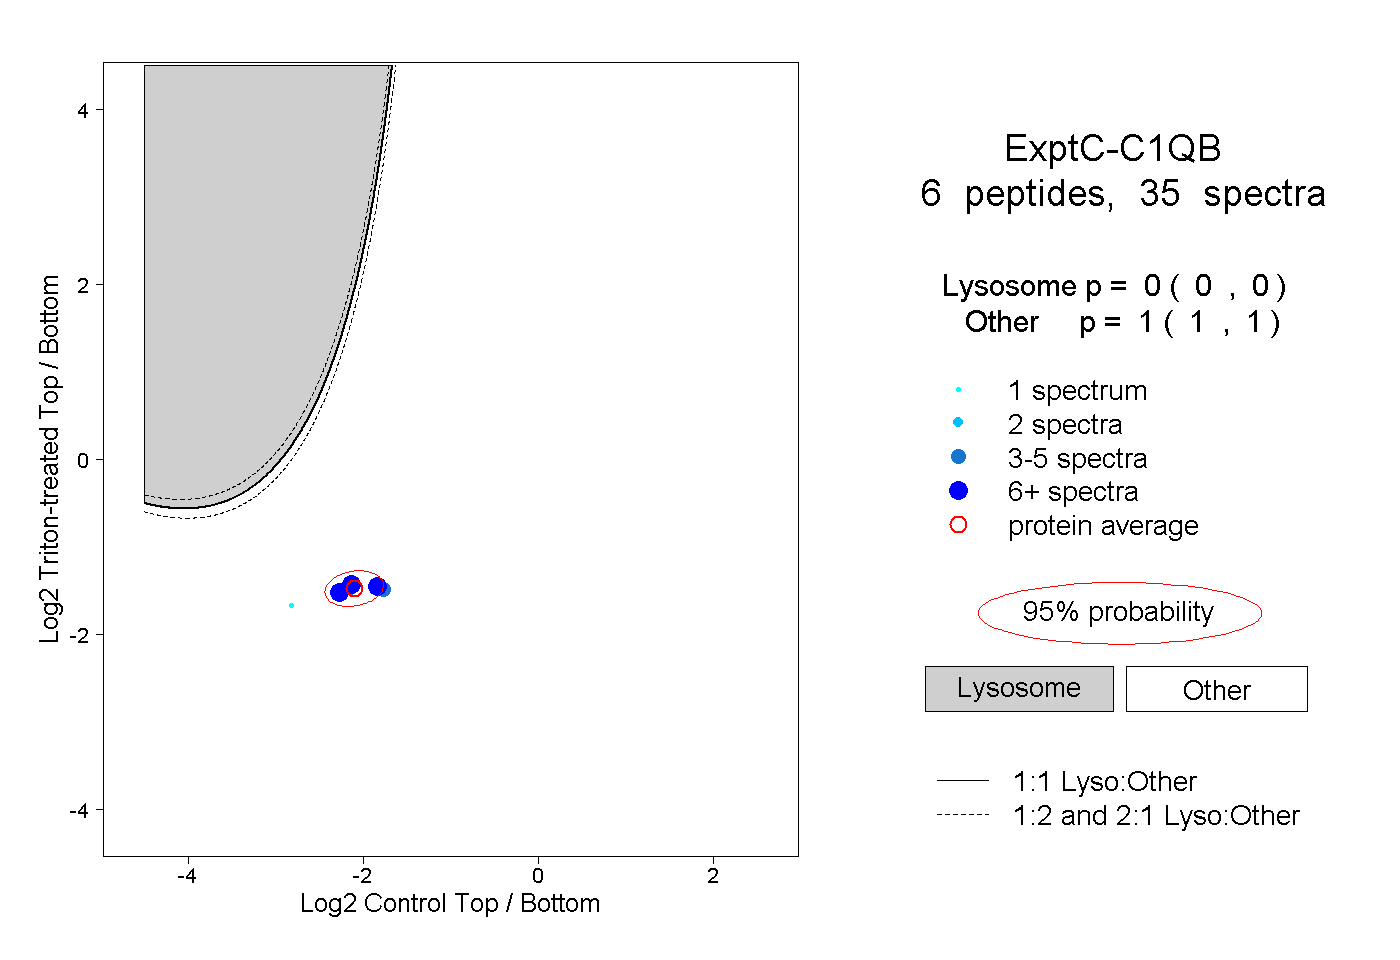 |
0.000 0.000 | 0.000 |
1.000 1.000 | 1.000 |
||||||||
| Plot | Lyso | Other | |||||||||||
| Expt D |
4 peptides |
6 spectra |
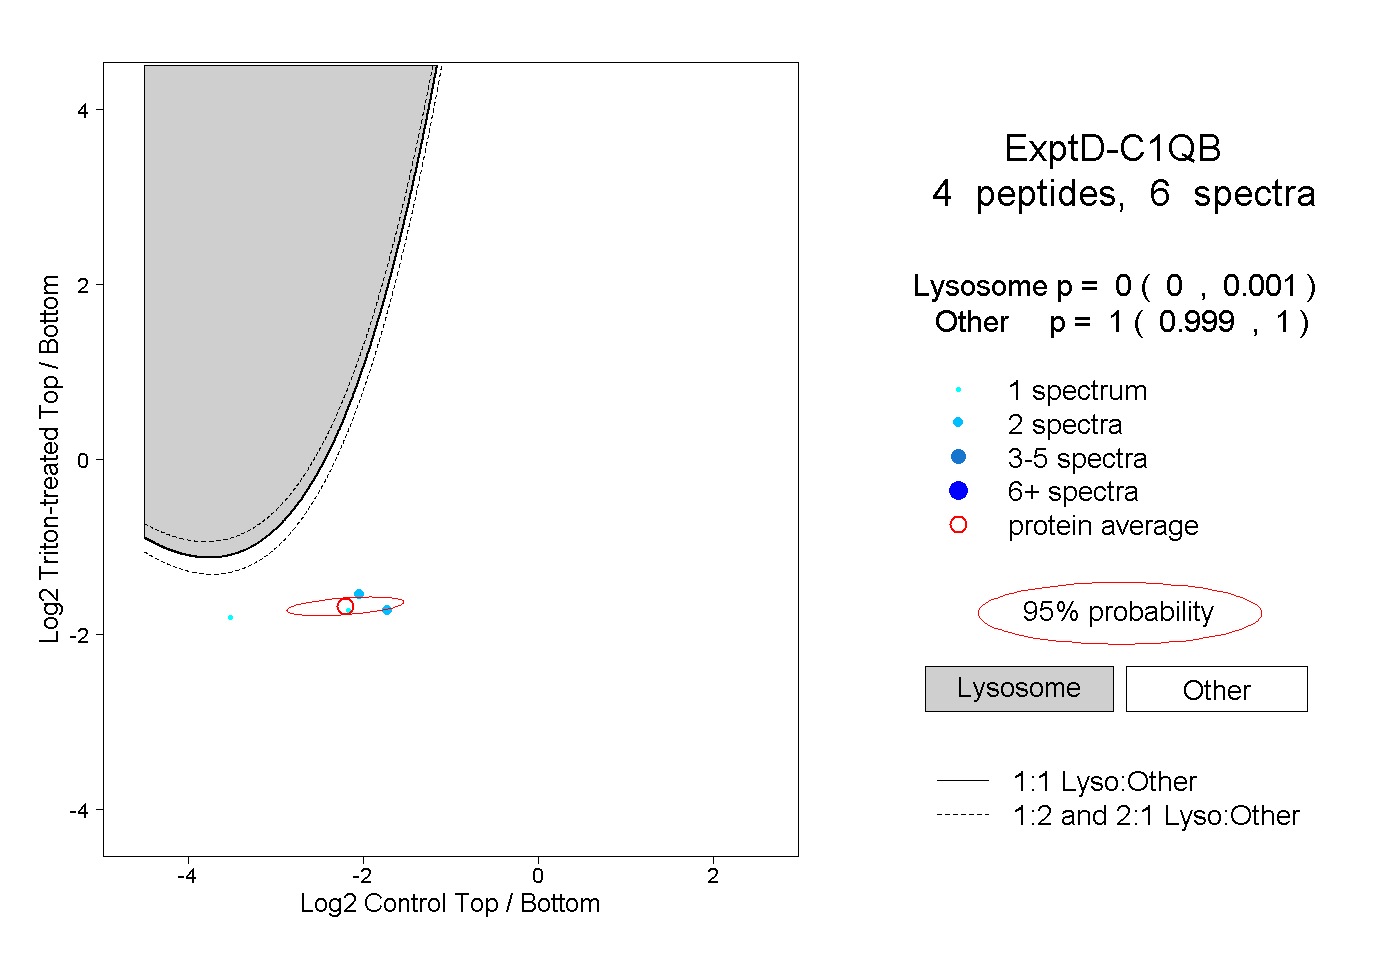 |
0.000 0.000 | 0.001 |
1.000 0.999 | 1.000 |