 8
8peptides
spectra
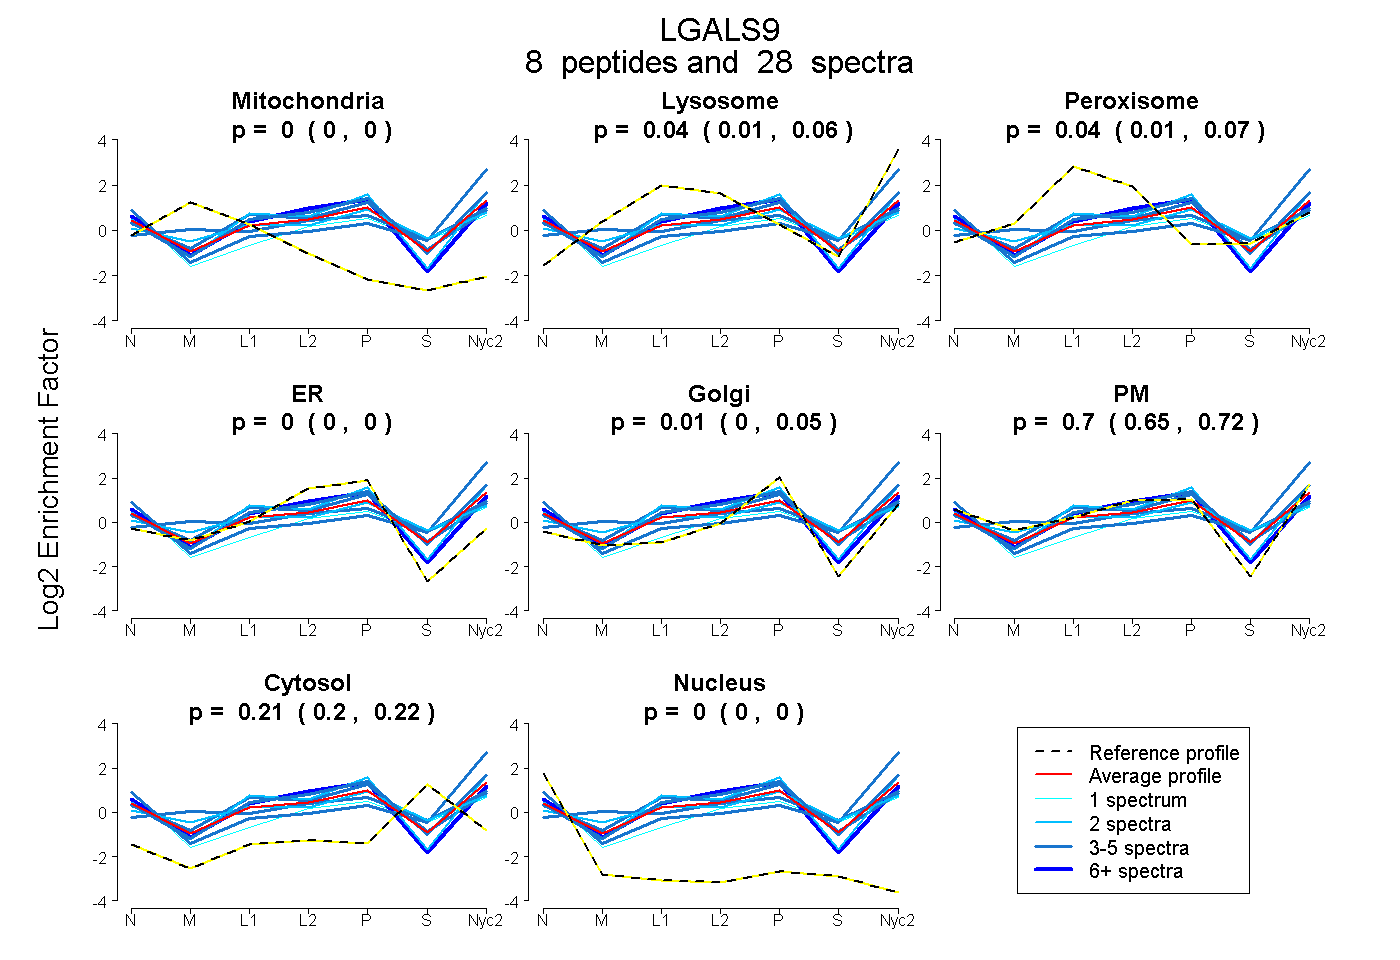
0.000 | 0.000
0.009 | 0.060
0.013 | 0.069
0.000 | 0.000
0.000 | 0.047
0.651 | 0.718
0.197 | 0.223
0.000 | 0.000
2peptides
spectra
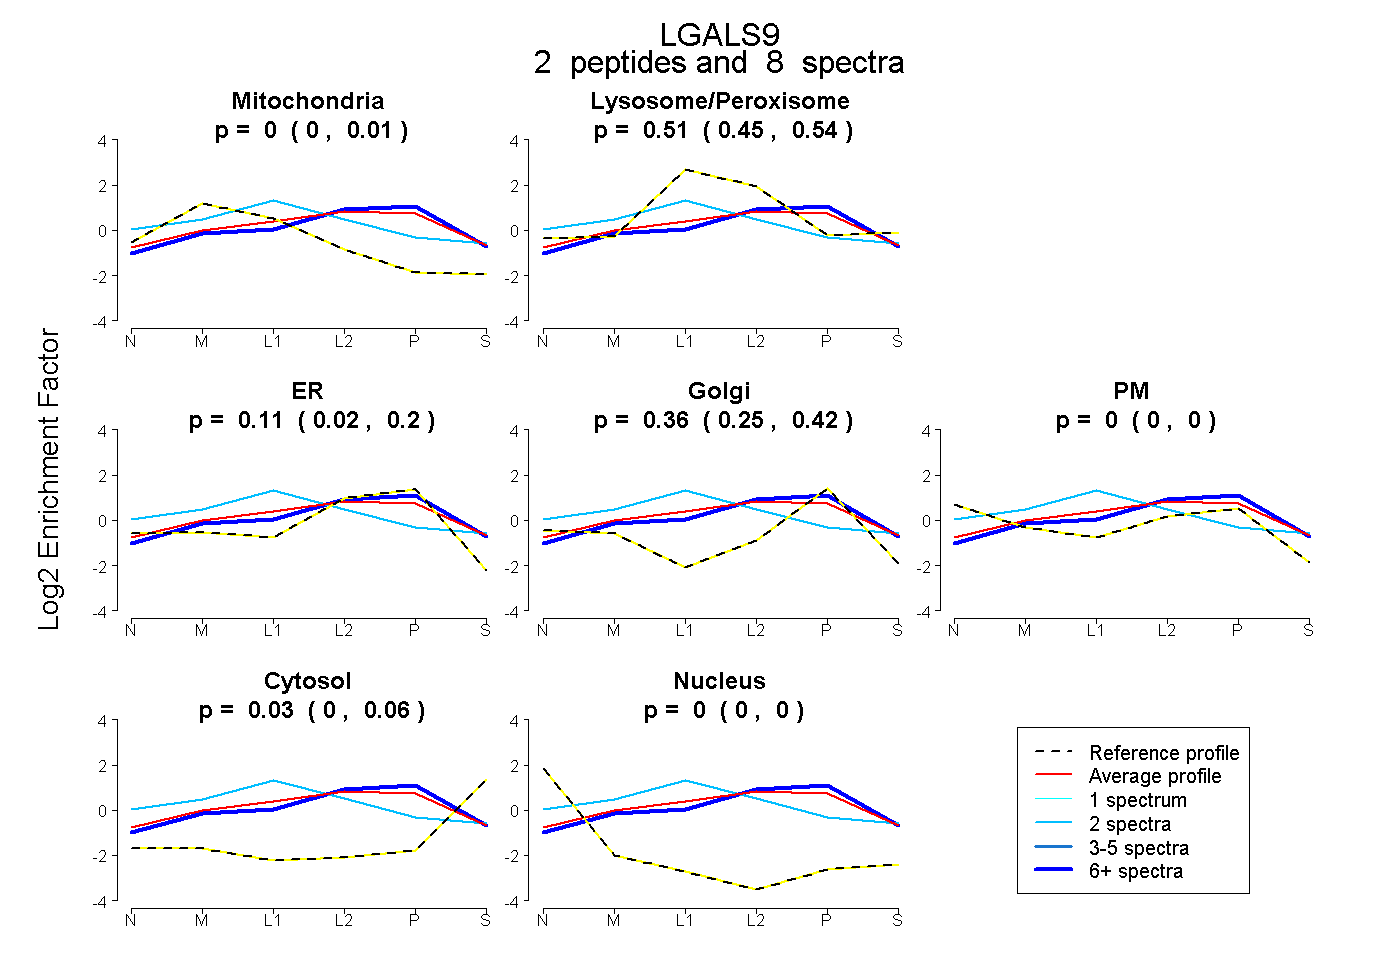
0.000 | 0.015
0.451 | 0.544
0.024 | 0.203
0.251 | 0.423
0.000 | 0.000
0.000 | 0.059
0.000 | 0.000
10peptides
spectra
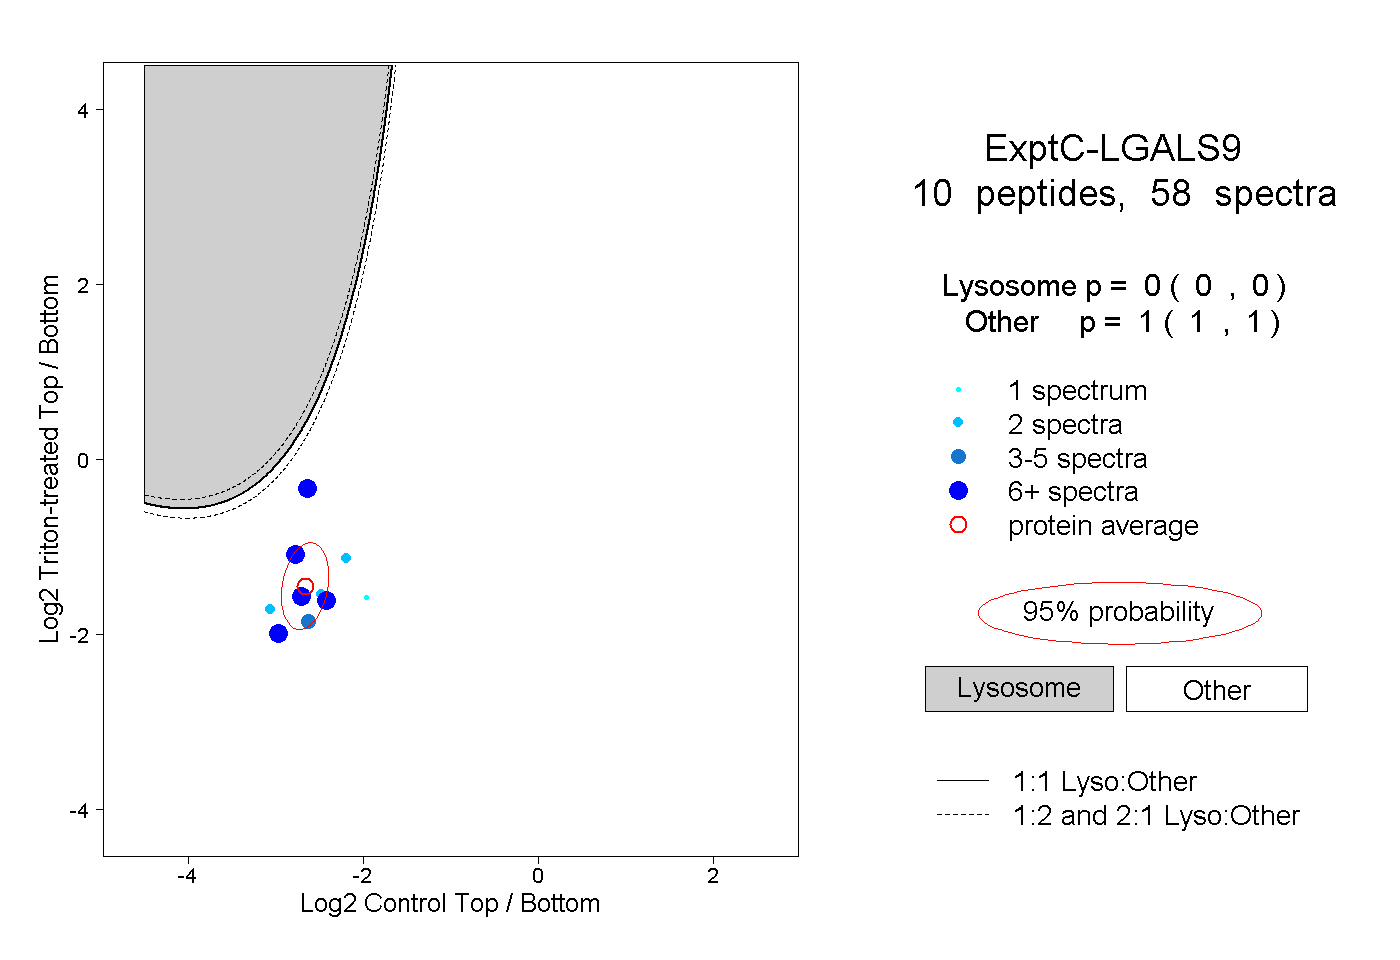
0.000 | 0.000
1.000 | 1.000
4peptides
spectra
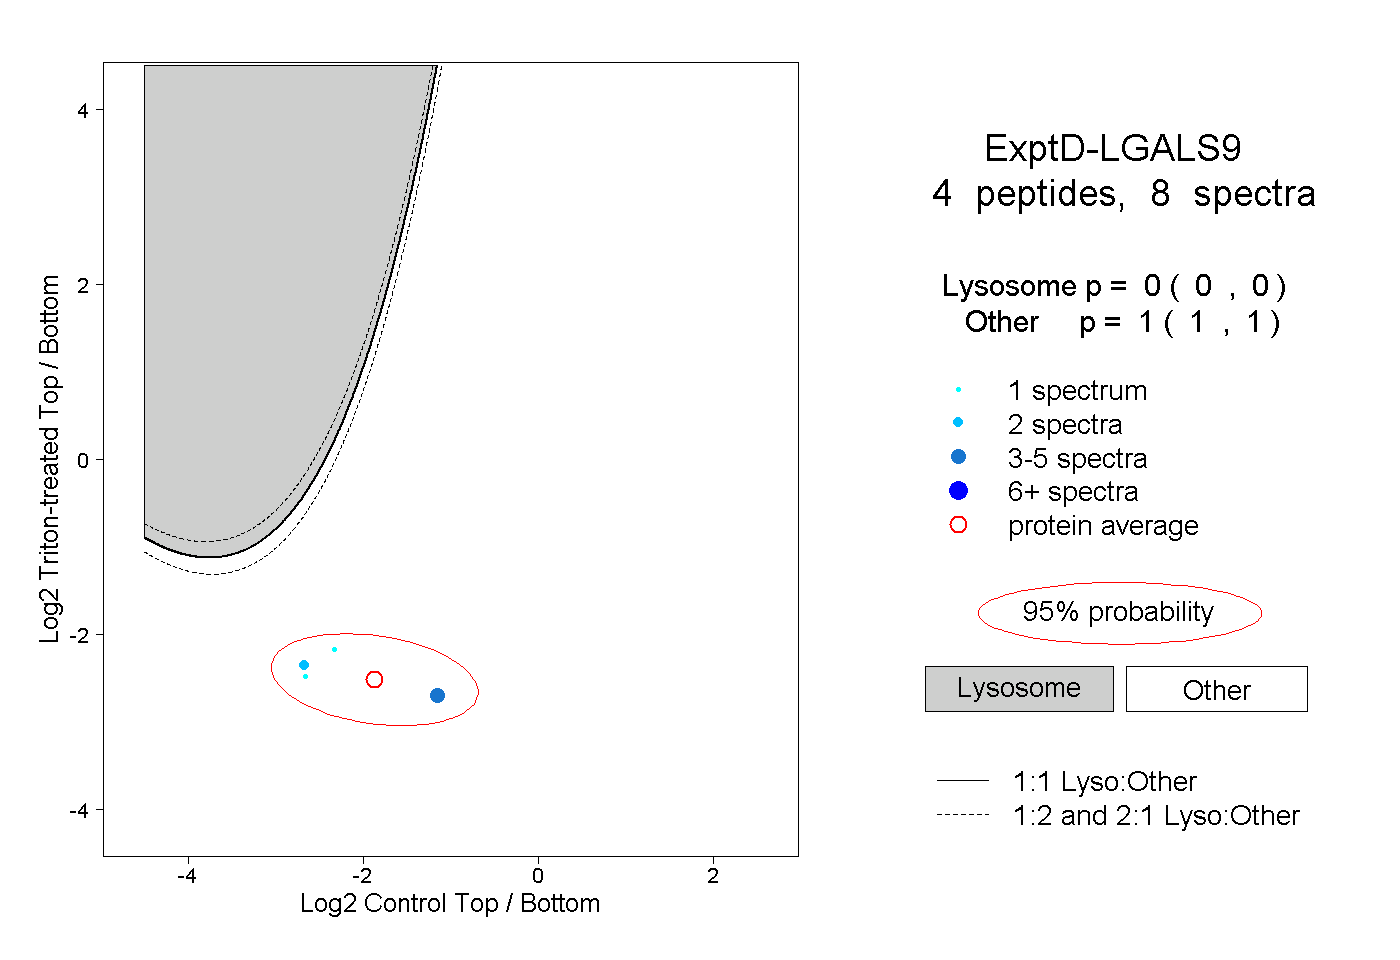
0.000 | 0.000
1.000 | 1.000