 4
4peptides
spectra
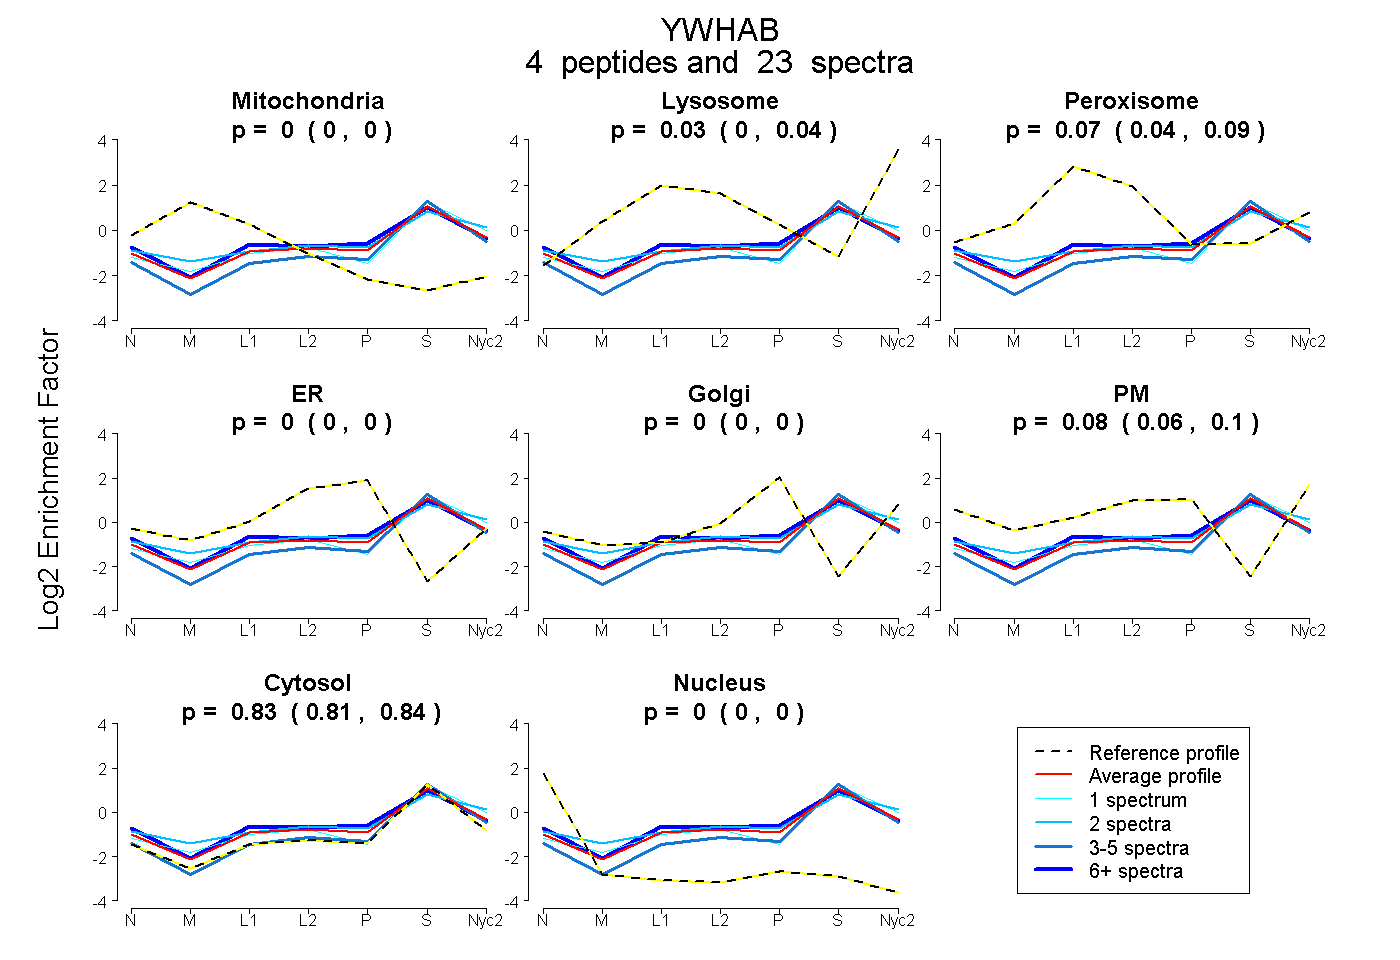
0.000 | 0.000
0.005 | 0.044
0.038 | 0.088
0.000 | 0.000
0.000 | 0.004
0.057 | 0.102
0.813 | 0.837
0.000 | 0.000
2peptides
spectra
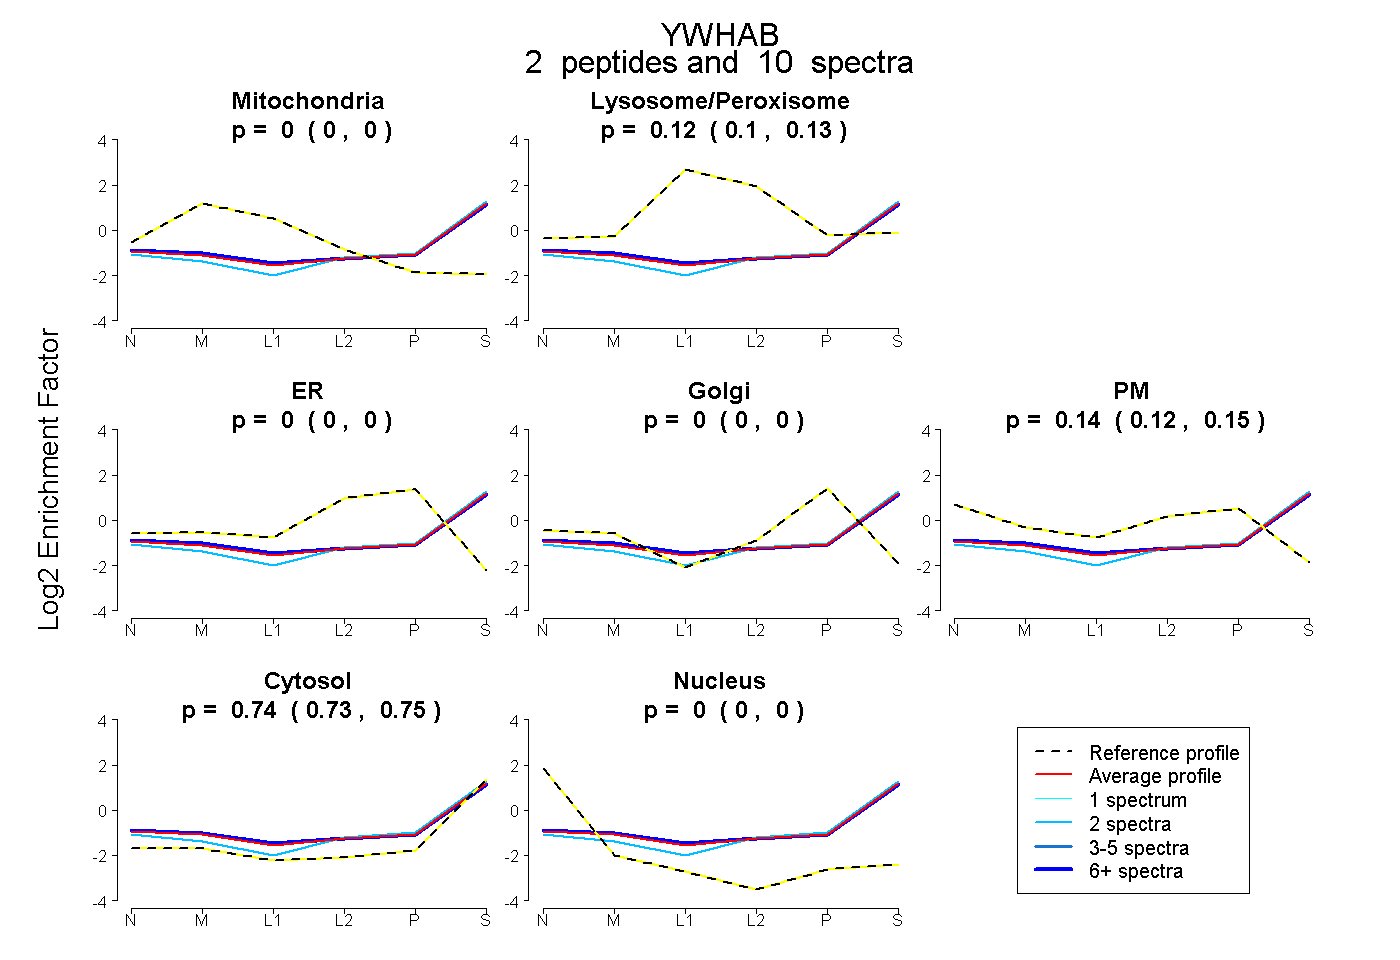
0.000 | 0.000
0.098 | 0.134
0.000 | 0.000
0.000 | 0.000
0.121 | 0.154
0.732 | 0.752
0.000 | 0.000
3peptides
spectra
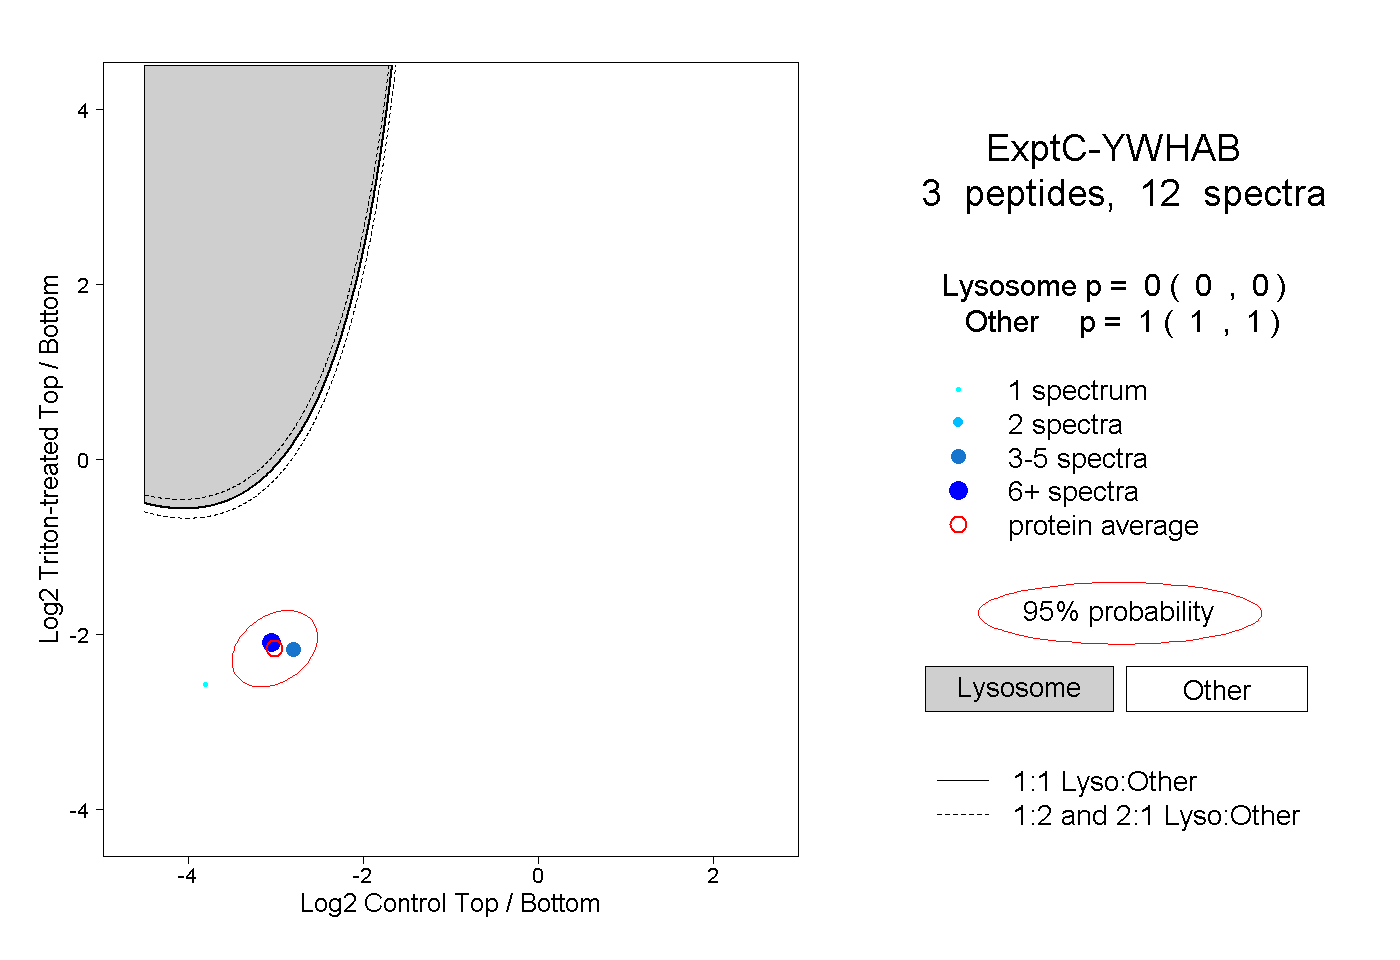
0.000 | 0.000
1.000 | 1.000
1peptide
spectra
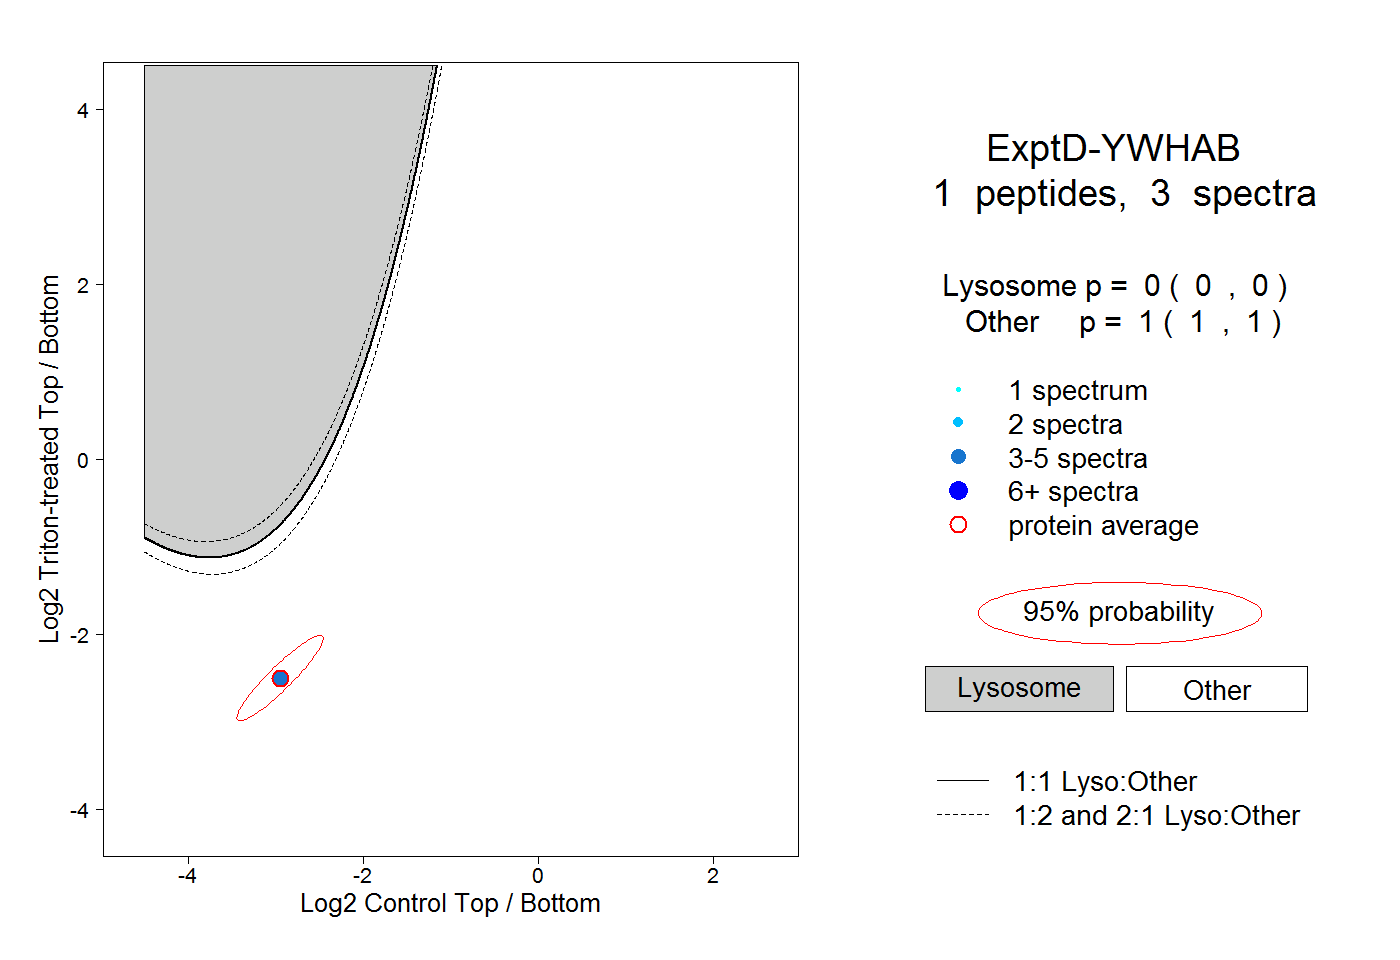
0.000 | 0.000
1.000 | 1.000