 4
4peptides
spectra
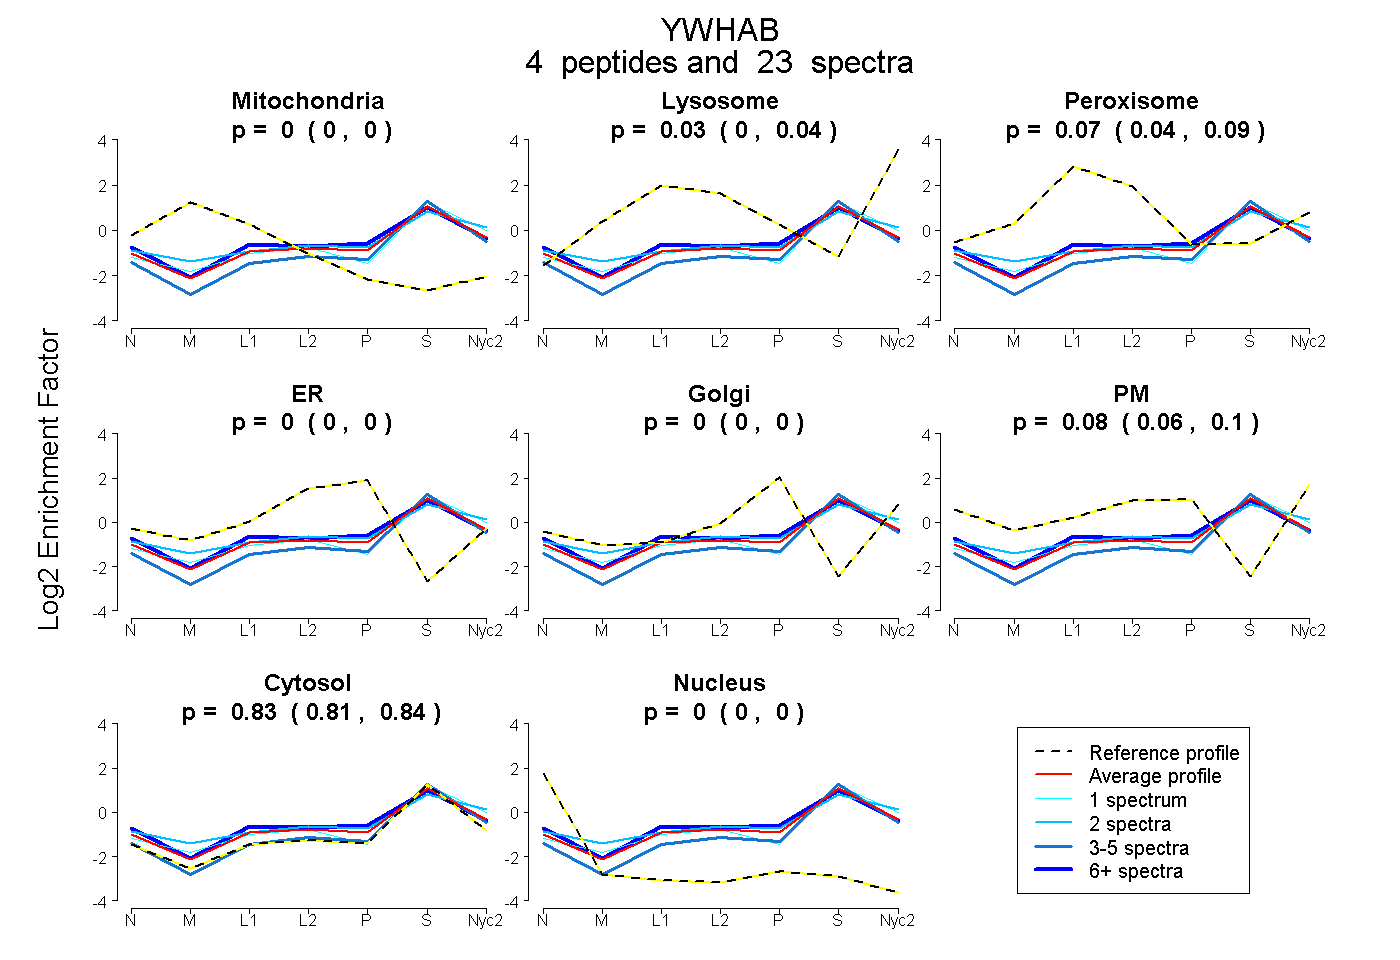
0.000 | 0.000
0.005 | 0.044
0.038 | 0.088
0.000 | 0.000
0.000 | 0.004
0.057 | 0.102
0.813 | 0.837
0.000 | 0.000
| Plot | Mito | Lyso | Perox | ER | Golgi | PM | Cytosol | Nucleus | |||||
| Expt A |
4 peptides |
23 spectra |
|
0.000 0.000 | 0.000 |
0.026 0.005 | 0.044 |
0.065 0.038 | 0.088 |
0.000 0.000 | 0.000 |
0.000 0.000 | 0.004 |
0.082 0.057 | 0.102 |
0.827 0.813 | 0.837 |
0.000 0.000 | 0.000 |
| 2 spectra, YLSEVASGDNK | 0.001 | 0.117 | 0.013 | 0.000 | 0.000 | 0.141 | 0.728 | 0.000 | ||
| 4 spectra, YLILNATHAESK | 0.000 | 0.022 | 0.000 | 0.000 | 0.000 | 0.000 | 0.978 | 0.000 | ||
| 16 spectra, AVTEQGHELSNEER | 0.000 | 0.000 | 0.118 | 0.000 | 0.025 | 0.096 | 0.761 | 0.000 | ||
| 1 spectrum, QTTVSNSQQAYQEAFEISK | 0.000 | 0.127 | 0.030 | 0.000 | 0.000 | 0.000 | 0.843 | 0.000 |
| Plot | Mito | Lyso or Perox | ER | Golgi | PM | Cytosol | Nucleus | ||||||
| Expt B |
2 peptides |
10 spectra |
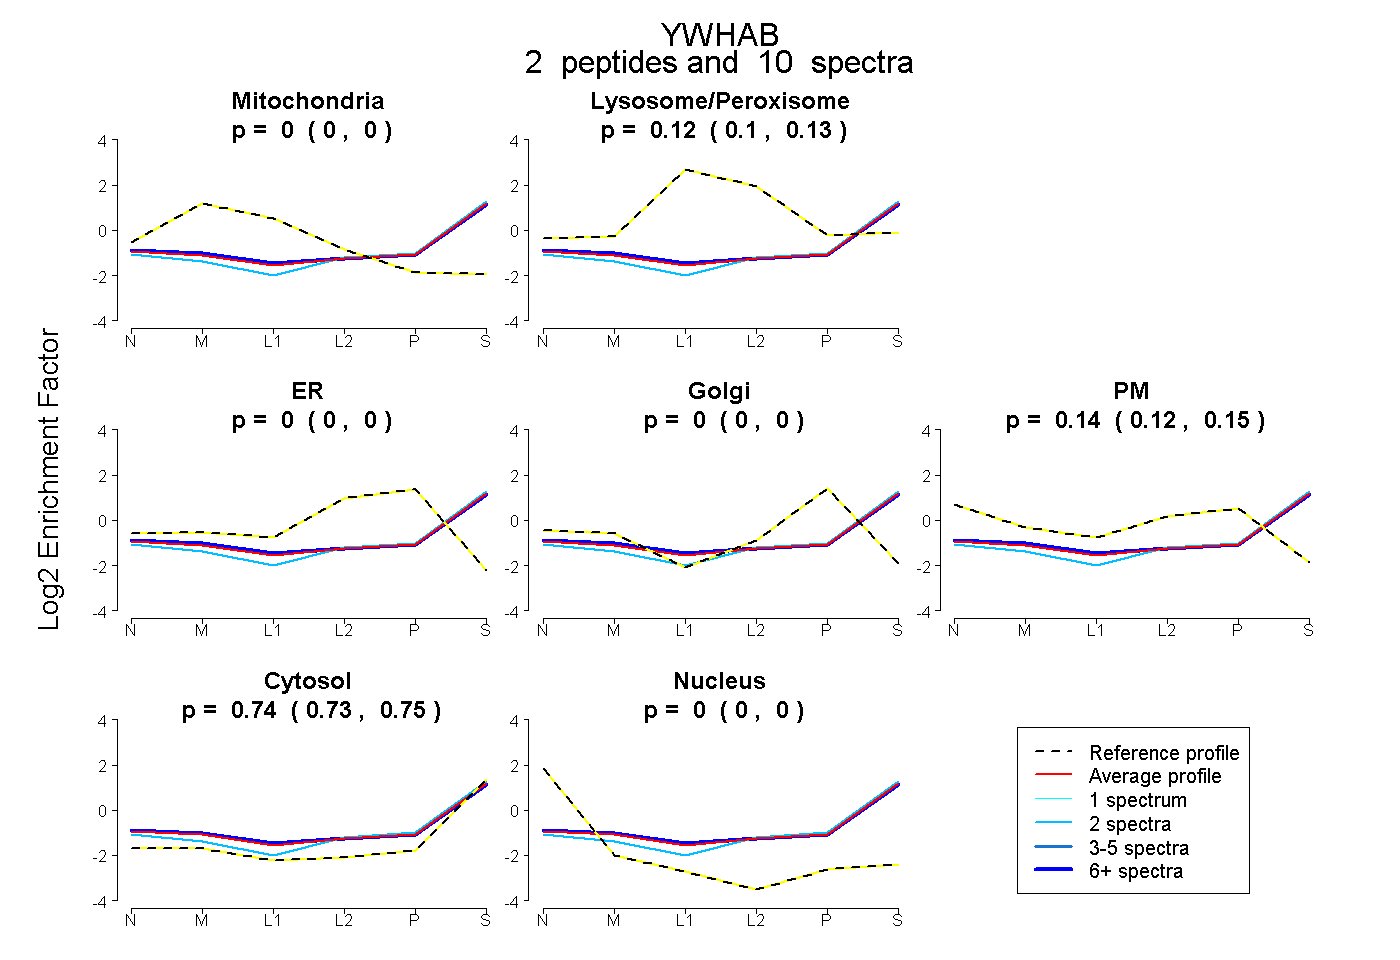 |
0.000 0.000 | 0.000 |
0.118 0.098 | 0.134 |
0.000 0.000 | 0.000 |
0.000 0.000 | 0.000 |
0.140 0.121 | 0.154 |
0.743 0.732 | 0.752 |
0.000 0.000 | 0.000 |
|||
| Plot | Lyso | Other | |||||||||||
| Expt C |
3 peptides |
12 spectra |
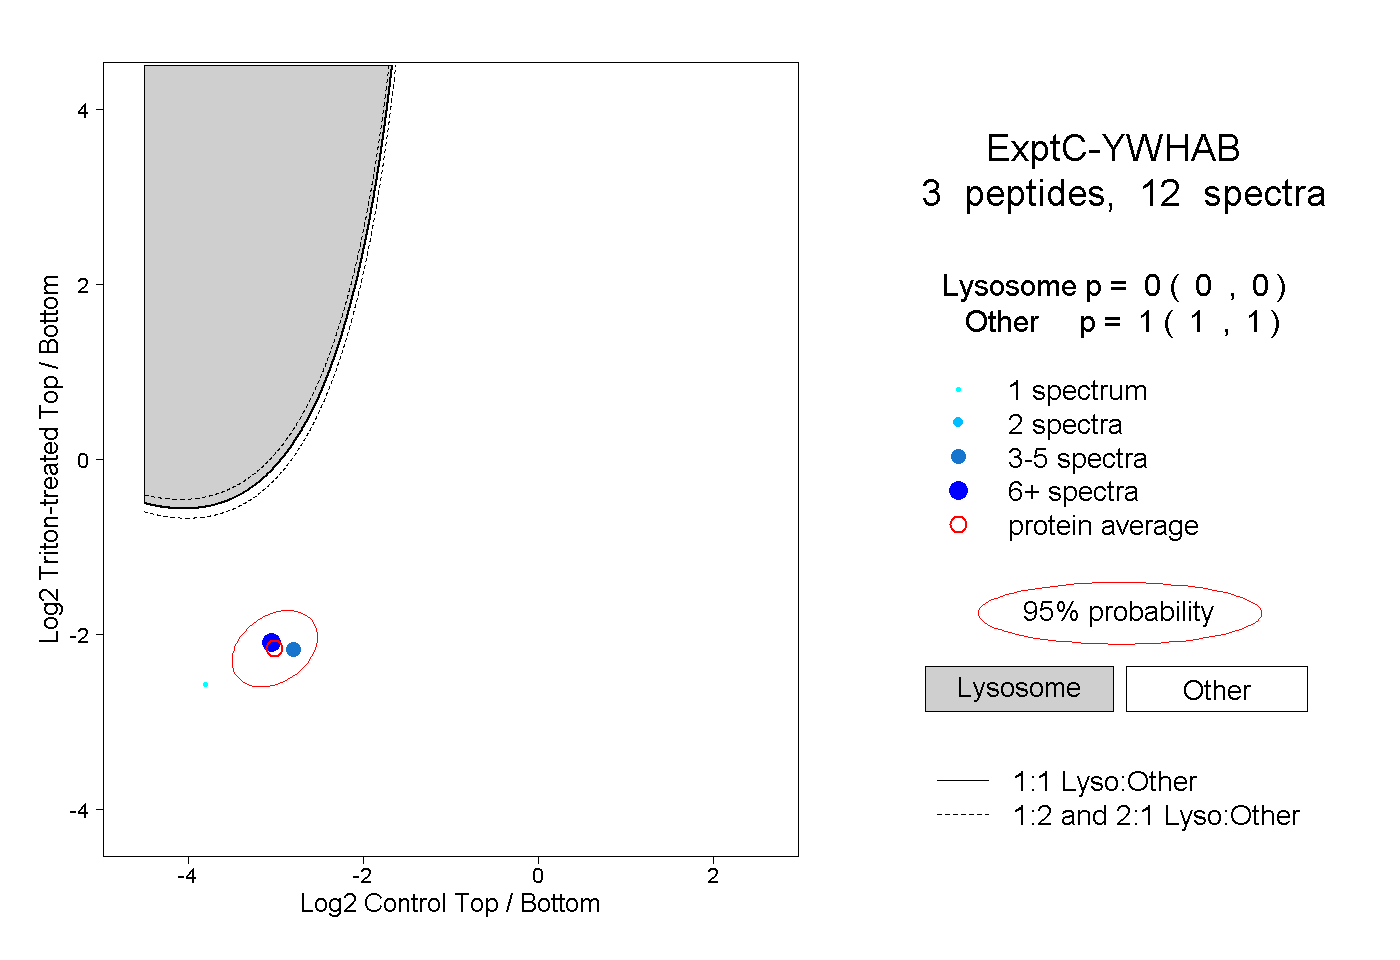 |
0.000 0.000 | 0.000 |
1.000 1.000 | 1.000 |
||||||||
| Plot | Lyso | Other | |||||||||||
| Expt D |
1 peptide |
3 spectra |
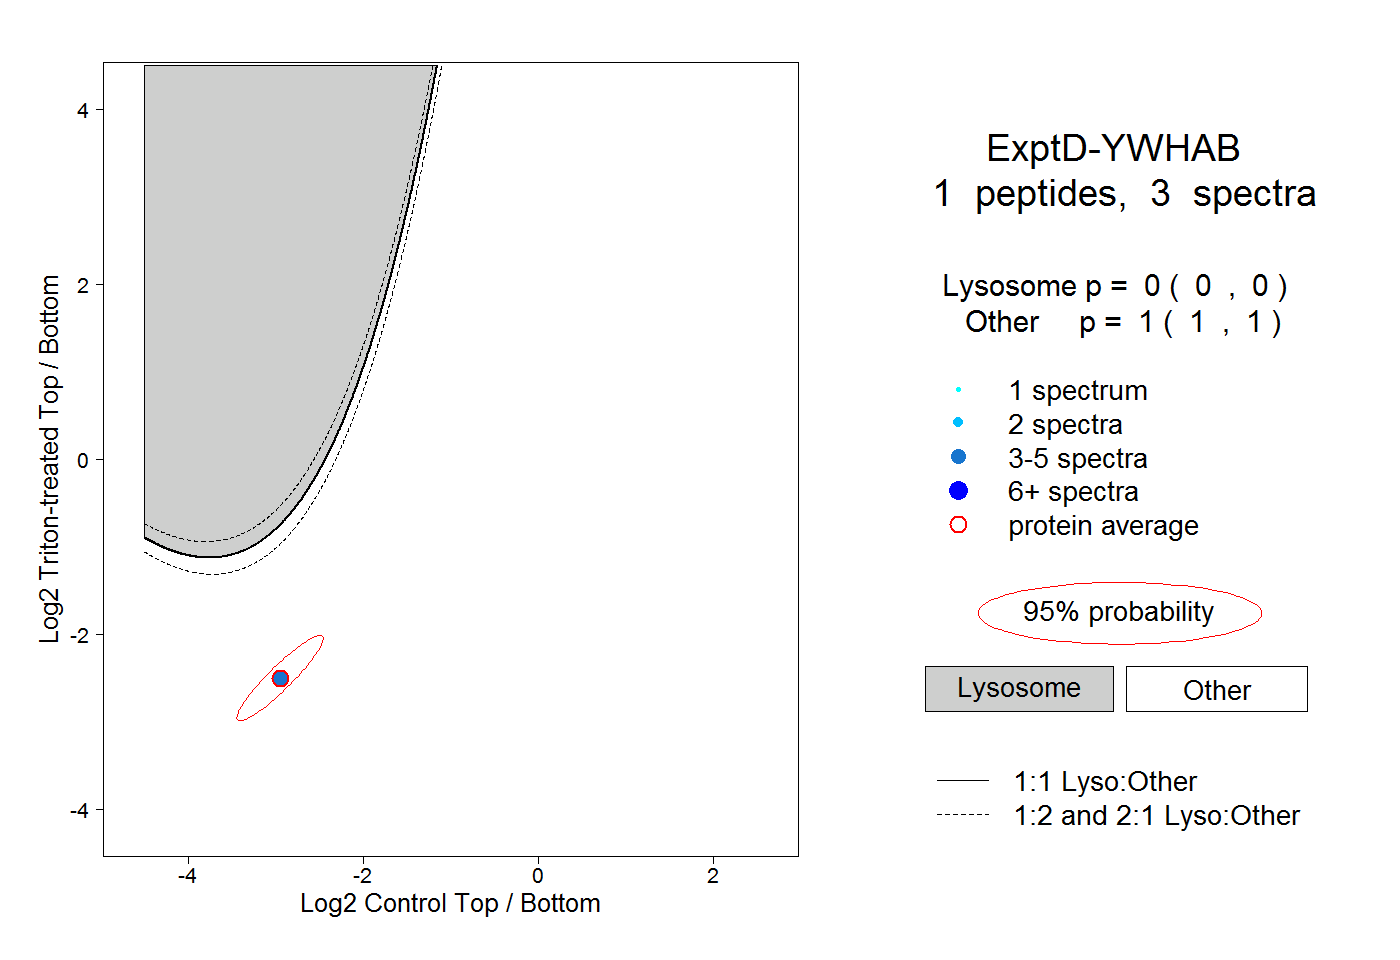 |
0.000 0.000 | 0.000 |
1.000 1.000 | 1.000 |