 6
6peptides
spectra
0.000 | 0.066
0.000 | 0.000
0.000 | 0.153
0.000 | 0.216
0.000 | 0.000
0.000 | 0.127
0.248 | 0.365
0.395 | 0.510
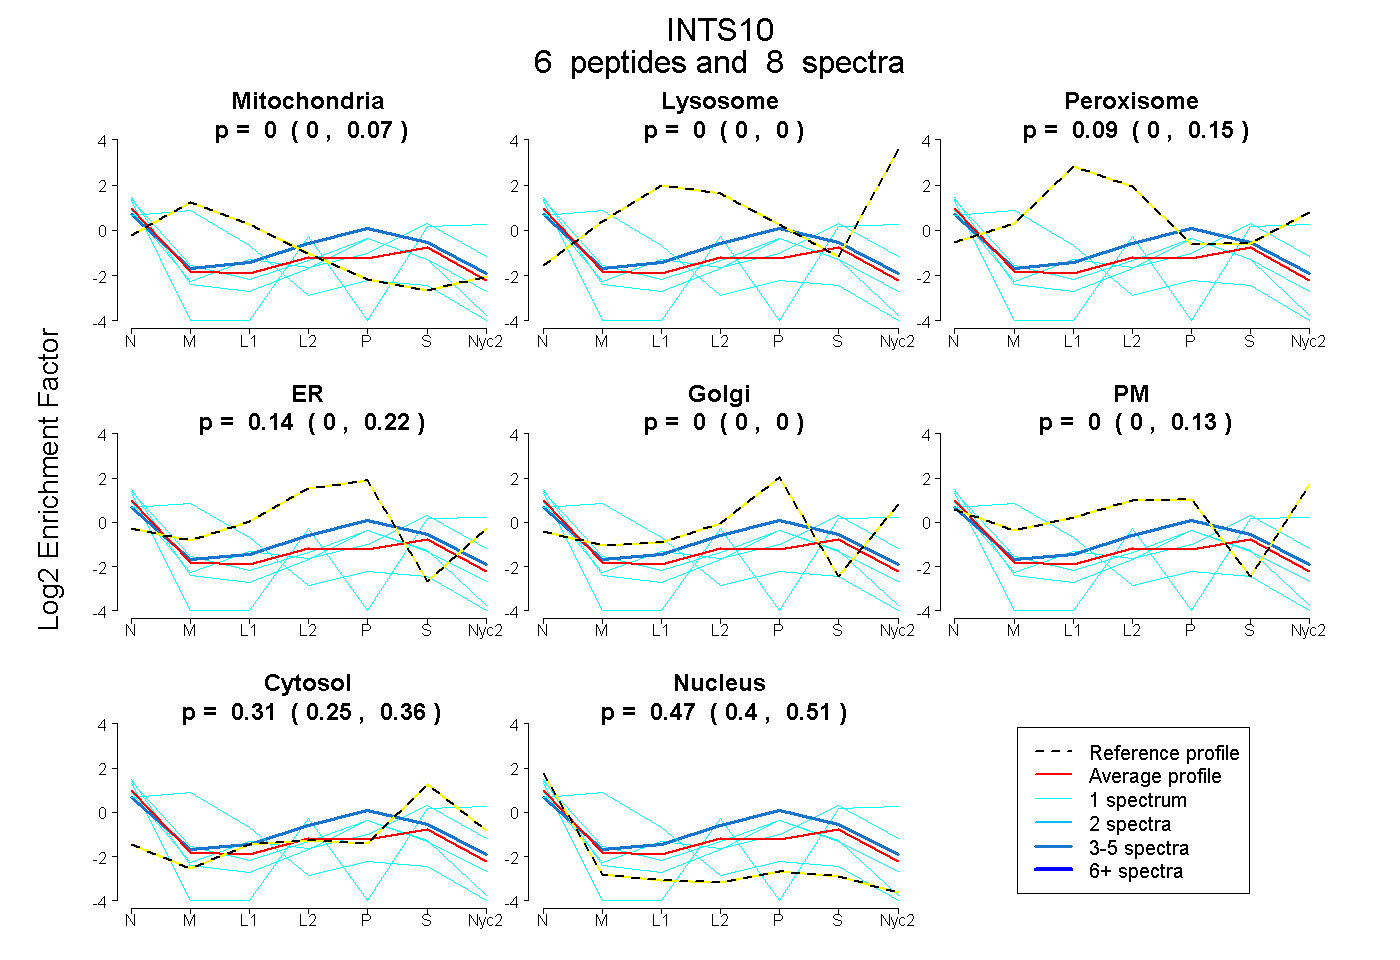
| Plot | Mito | Lyso | Perox | ER | Golgi | PM | Cytosol | Nucleus | |||||
| Expt A |
6 peptides |
8 spectra |
|
0.000 0.000 | 0.066 |
0.000 0.000 | 0.000 |
0.086 0.000 | 0.153 |
0.138 0.000 | 0.216 |
0.000 0.000 | 0.000 |
0.000 0.000 | 0.127 |
0.309 0.248 | 0.365 |
0.466 0.395 | 0.510 |