 6
6peptides
spectra
0.000 | 0.066
0.000 | 0.000
0.000 | 0.153
0.000 | 0.216
0.000 | 0.000
0.000 | 0.127
0.248 | 0.365
0.395 | 0.510
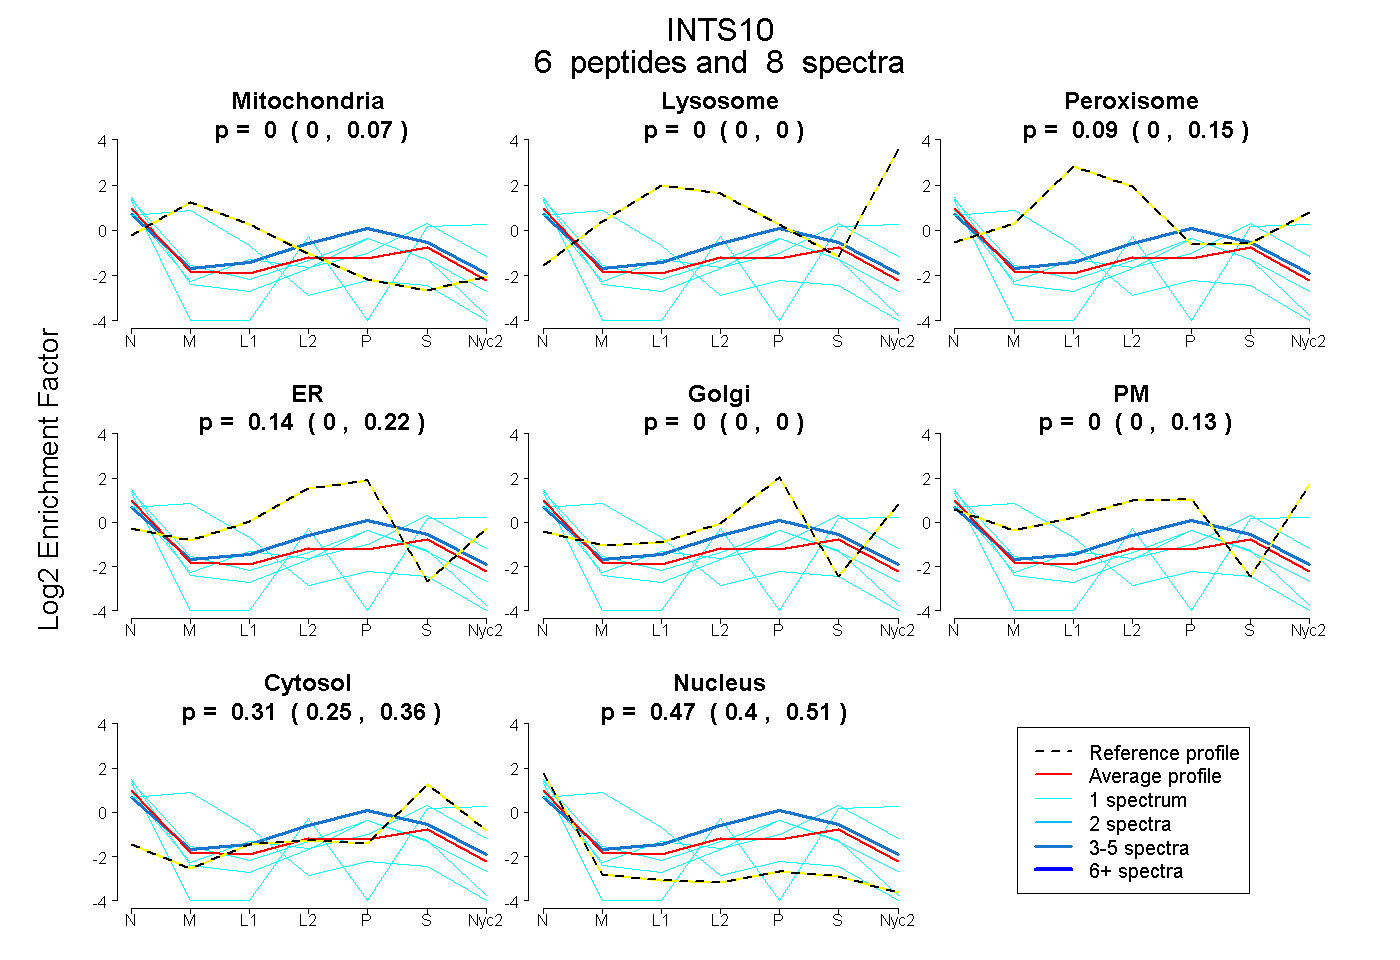
| Plot | Mito | Lyso | Perox | ER | Golgi | PM | Cytosol | Nucleus | |||||
| Expt A |
6 peptides |
8 spectra |
|
0.000 0.000 | 0.066 |
0.000 0.000 | 0.000 |
0.086 0.000 | 0.153 |
0.138 0.000 | 0.216 |
0.000 0.000 | 0.000 |
0.000 0.000 | 0.127 |
0.309 0.248 | 0.365 |
0.466 0.395 | 0.510 |
| 1 spectrum, EISIITSALR | 0.000 | 0.000 | 0.000 | 0.137 | 0.112 | 0.000 | 0.170 | 0.581 | ||
| 1 spectrum, ADLSNSIEVLESFK | 0.000 | 0.000 | 0.000 | 0.000 | 0.000 | 0.000 | 0.624 | 0.376 | ||
| 1 spectrum, SLFETLPGR | 0.654 | 0.000 | 0.000 | 0.000 | 0.000 | 0.000 | 0.000 | 0.346 | ||
| 3 spectra, ILNVVGMR | 0.000 | 0.000 | 0.000 | 0.382 | 0.000 | 0.000 | 0.351 | 0.267 | ||
| 1 spectrum, HIVVSK | 0.000 | 0.000 | 0.025 | 0.000 | 0.000 | 0.148 | 0.553 | 0.274 | ||
| 1 spectrum, ALIQLATCHFALGEYR | 0.000 | 0.000 | 0.000 | 0.287 | 0.000 | 0.000 | 0.114 | 0.599 |