 11
11peptides
spectra
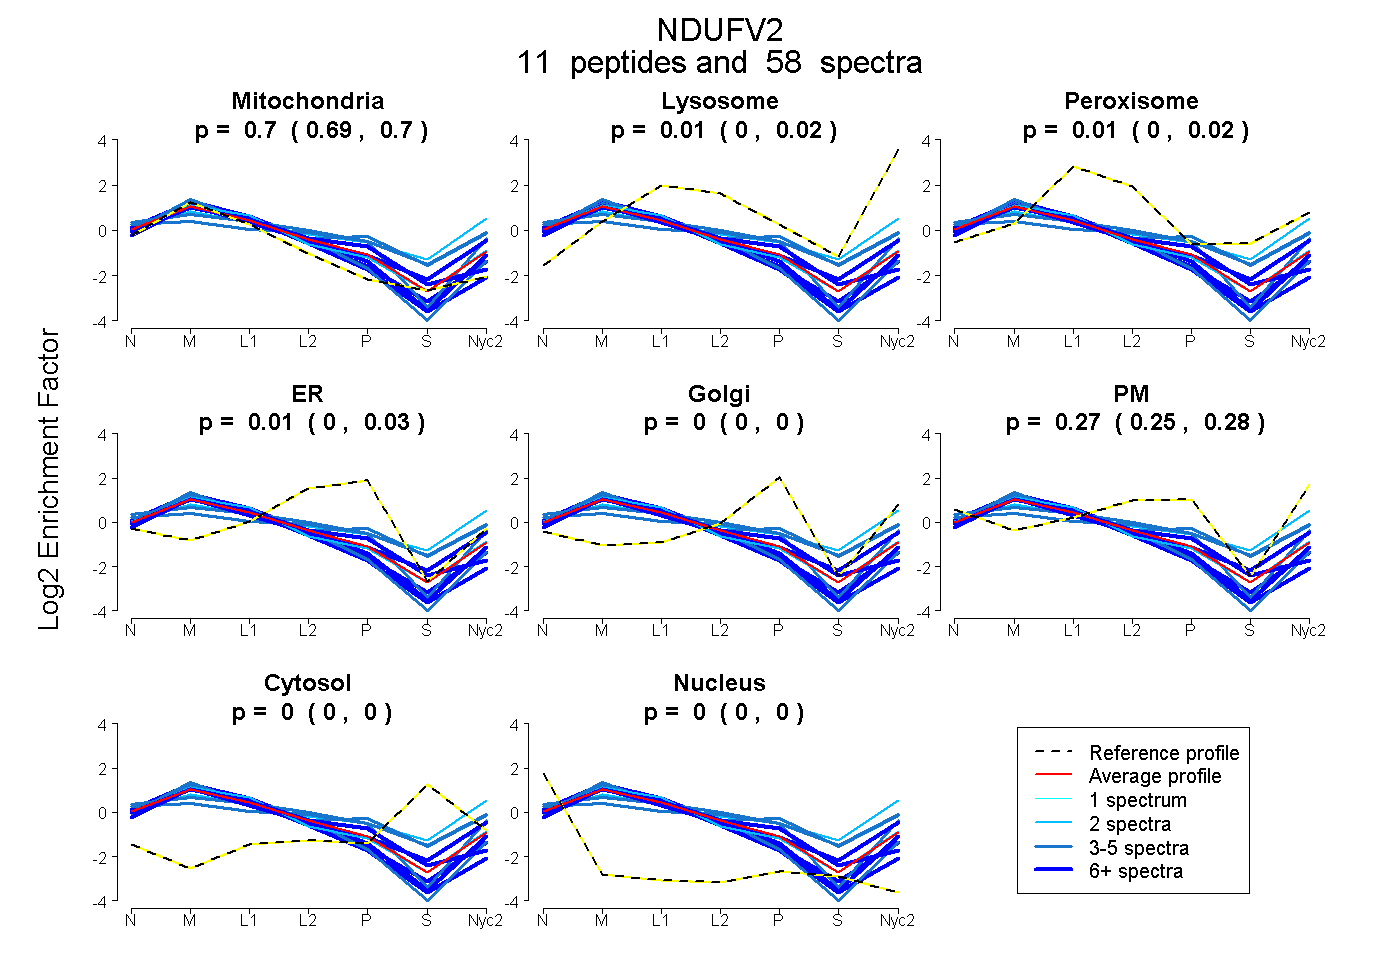
0.690 | 0.703
0.000 | 0.021
0.000 | 0.022
0.000 | 0.026
0.000 | 0.000
0.254 | 0.282
0.000 | 0.000
0.000 | 0.000
7peptides
spectra
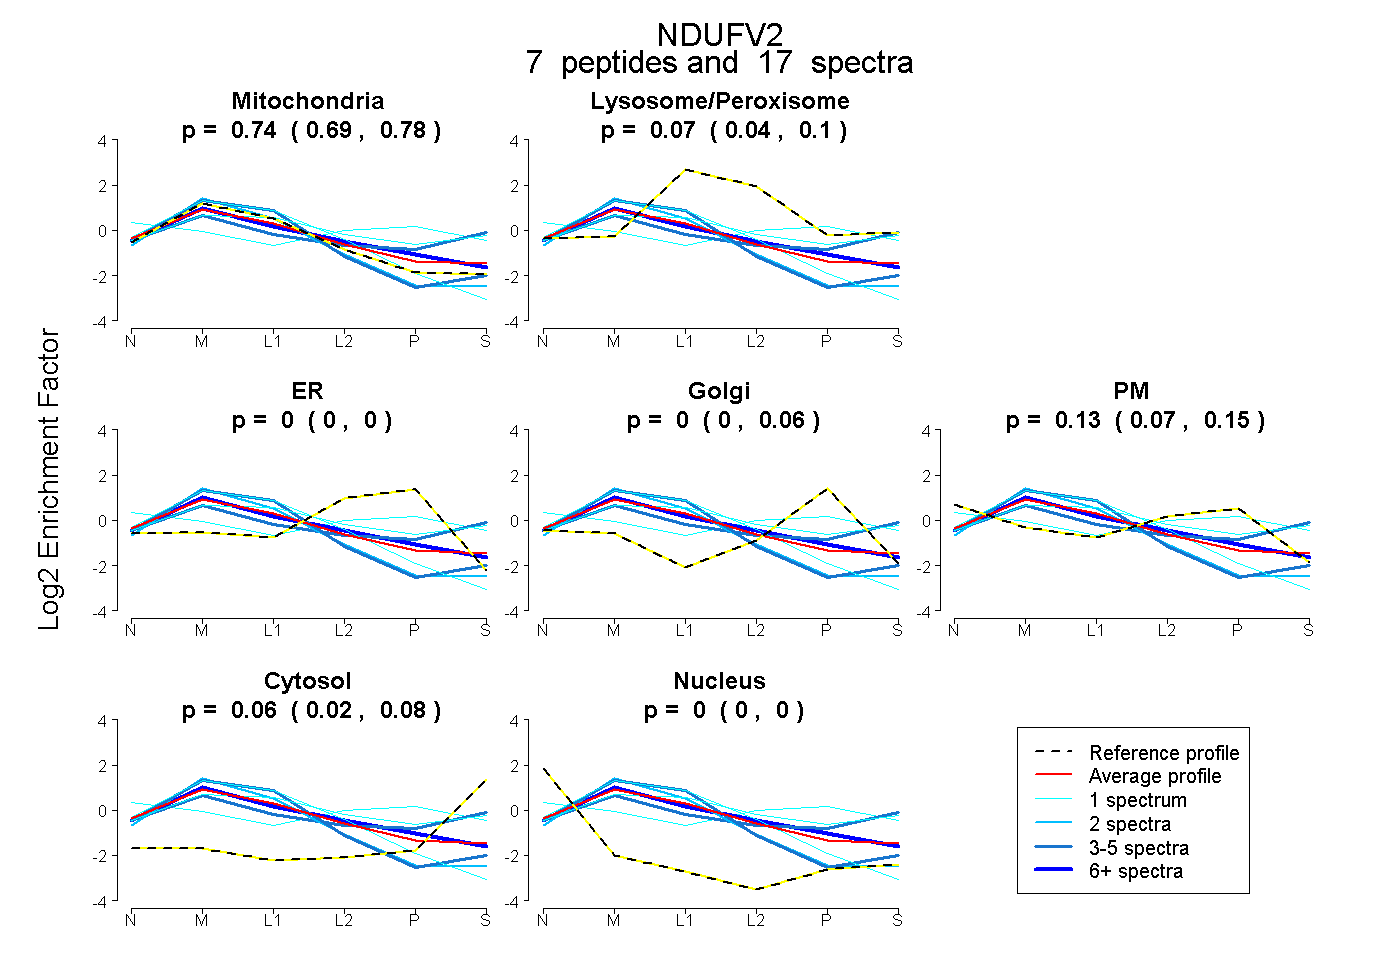
0.694 | 0.775
0.043 | 0.097
0.000 | 0.000
0.000 | 0.062
0.069 | 0.150
0.022 | 0.082
0.000 | 0.000
10peptides
spectra
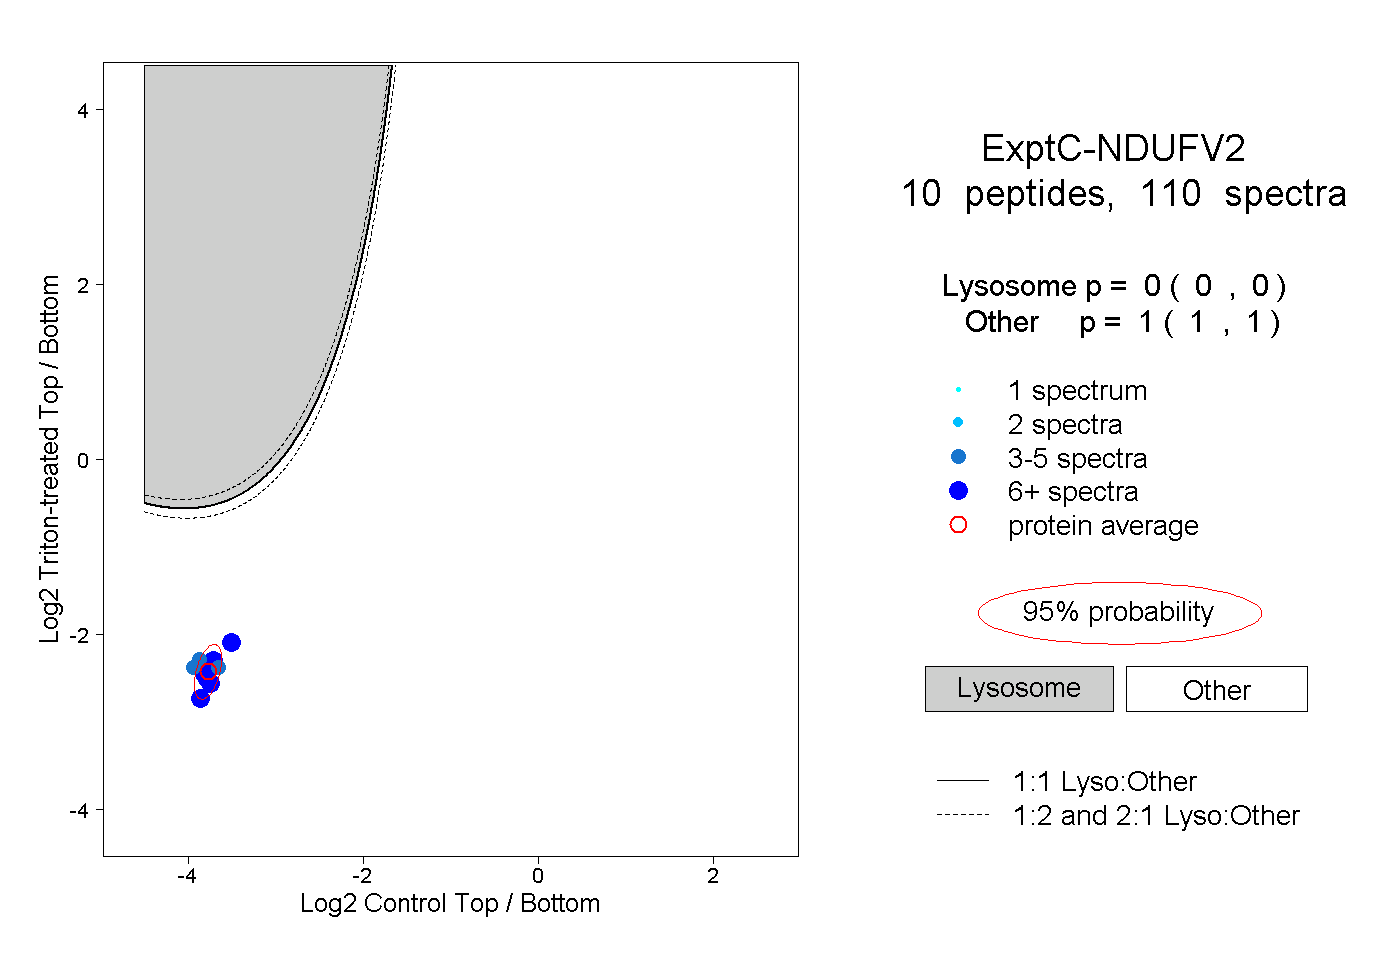
0.000 | 0.000
1.000 | 1.000
6peptides
spectra

0.000 | 0.292
0.705 | 1.000