 11
11peptides
spectra
0.690 | 0.703
0.000 | 0.021
0.000 | 0.022
0.000 | 0.026
0.000 | 0.000
0.254 | 0.282
0.000 | 0.000
0.000 | 0.000
| Plot | Mito | Lyso | Perox | ER | Golgi | PM | Cytosol | Nucleus | |||||
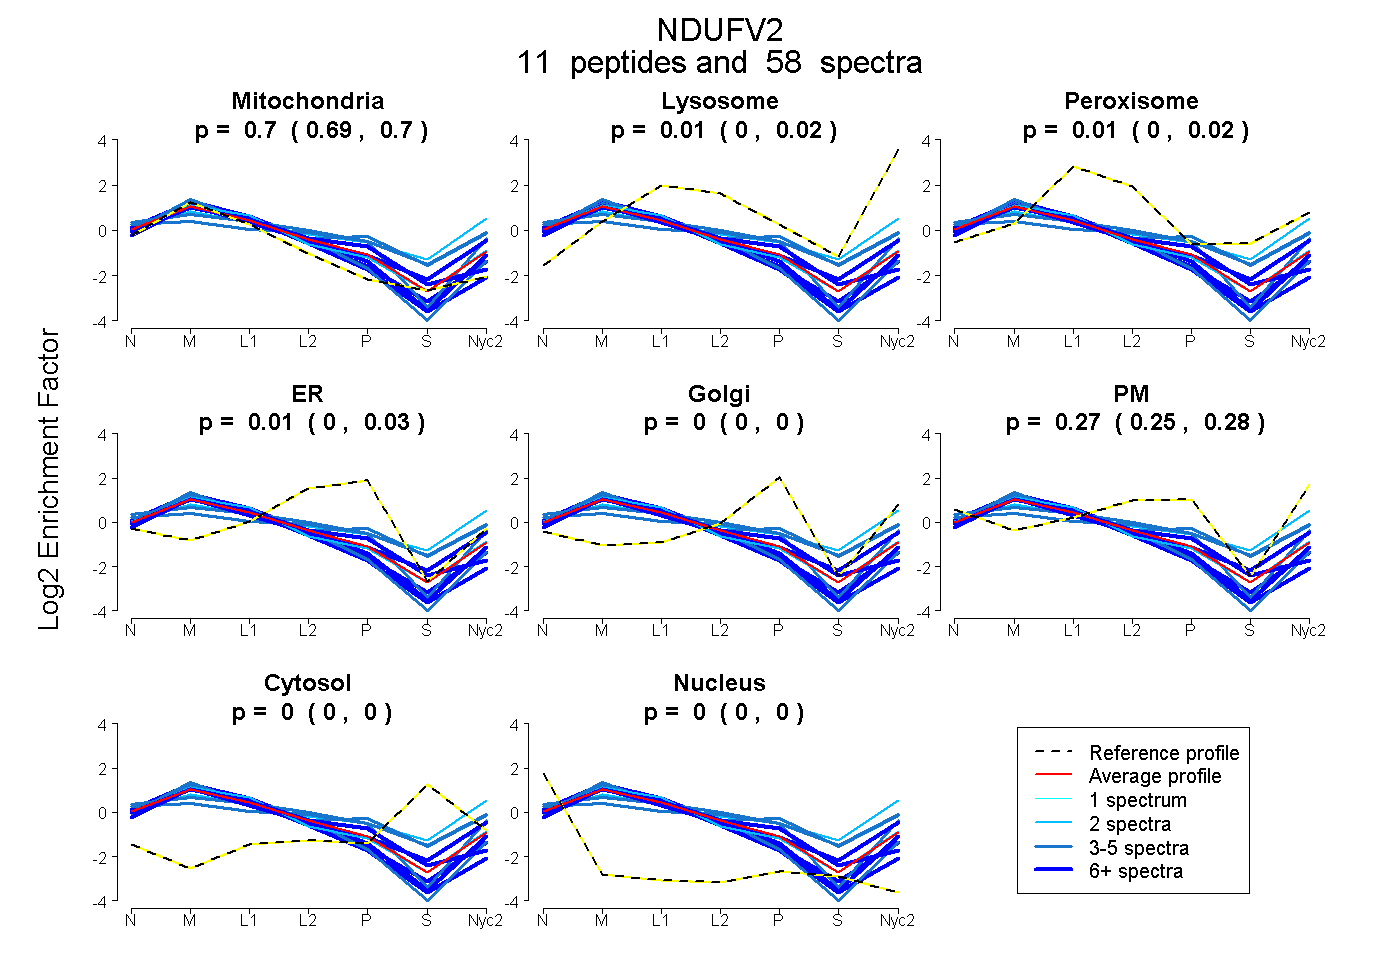
| Expt A |
11 peptides |
58 spectra |
|
0.697 0.690 | 0.703 |
0.013 0.000 | 0.021 |
0.009 0.000 | 0.022 |
0.013 0.000 | 0.026 |
0.000 0.000 | 0.000 |
0.269 0.254 | 0.282 |
0.000 0.000 | 0.000 |
0.000 0.000 | 0.000 |
| 6 spectra, VAEVLQVPPMR | 0.665 | 0.157 | 0.000 | 0.000 | 0.037 | 0.134 | 0.007 | 0.000 | ||
| 4 spectra, IEAIVR | 0.835 | 0.000 | 0.000 | 0.025 | 0.000 | 0.140 | 0.000 | 0.000 | ||
| 5 spectra, SLALR | 0.378 | 0.000 | 0.069 | 0.000 | 0.000 | 0.417 | 0.136 | 0.000 | ||
| 10 spectra, DIEEIIDELR | 0.905 | 0.000 | 0.000 | 0.095 | 0.000 | 0.000 | 0.000 | 0.000 | ||
| 8 spectra, YHIQVCTTTPCMLR | 0.705 | 0.000 | 0.037 | 0.258 | 0.000 | 0.000 | 0.000 | 0.000 | ||
| 2 spectra, VYEVATFYTMYNR | 0.733 | 0.069 | 0.000 | 0.000 | 0.000 | 0.199 | 0.000 | 0.000 | ||
| 7 spectra, AAAVLPVLDLAQR | 0.774 | 0.000 | 0.000 | 0.000 | 0.000 | 0.226 | 0.000 | 0.000 | ||
| 3 spectra, QNGWLPISAMNK | 0.563 | 0.033 | 0.000 | 0.073 | 0.000 | 0.331 | 0.000 | 0.000 | ||
| 3 spectra, NYPEGHR | 0.418 | 0.000 | 0.097 | 0.000 | 0.014 | 0.394 | 0.077 | 0.000 | ||
| 8 spectra, DSDSILETLQR | 0.823 | 0.000 | 0.000 | 0.000 | 0.000 | 0.177 | 0.000 | 0.000 | ||
| 2 spectra, GPGFGVQAGL | 0.399 | 0.230 | 0.000 | 0.000 | 0.000 | 0.269 | 0.101 | 0.000 |
| Plot | Mito | Lyso or Perox | ER | Golgi | PM | Cytosol | Nucleus | ||||||
| Expt B |
7 peptides |
17 spectra |
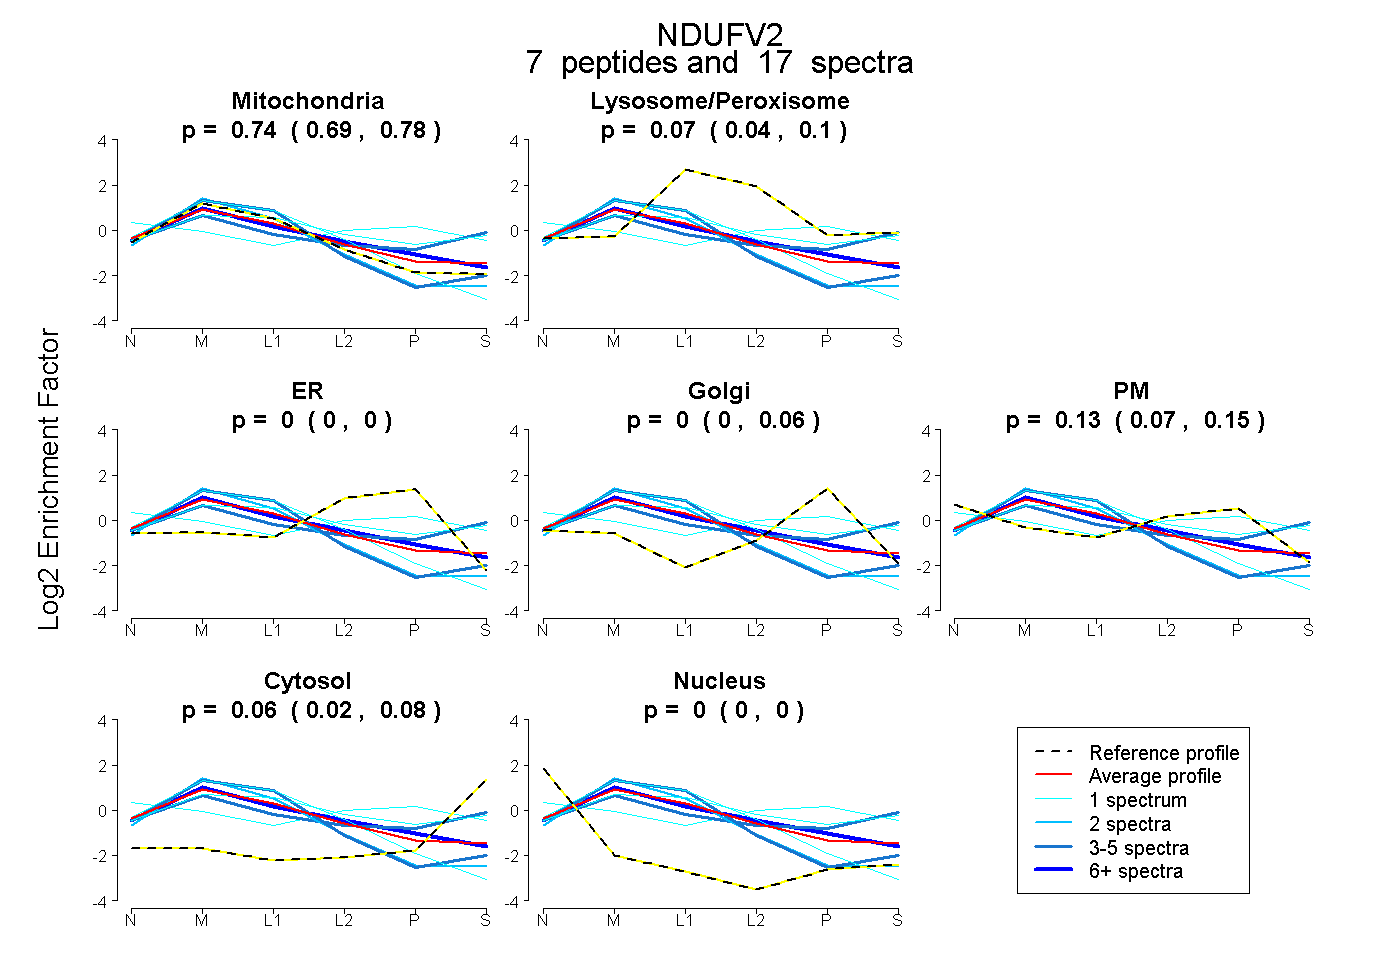 |
0.739 0.694 | 0.775 |
0.067 0.043 | 0.097 |
0.000 0.000 | 0.000 |
0.000 0.000 | 0.062 |
0.134 0.069 | 0.150 |
0.060 0.022 | 0.082 |
0.000 0.000 | 0.000 |
|||
| Plot | Lyso | Other | |||||||||||
| Expt C |
10 peptides |
110 spectra |
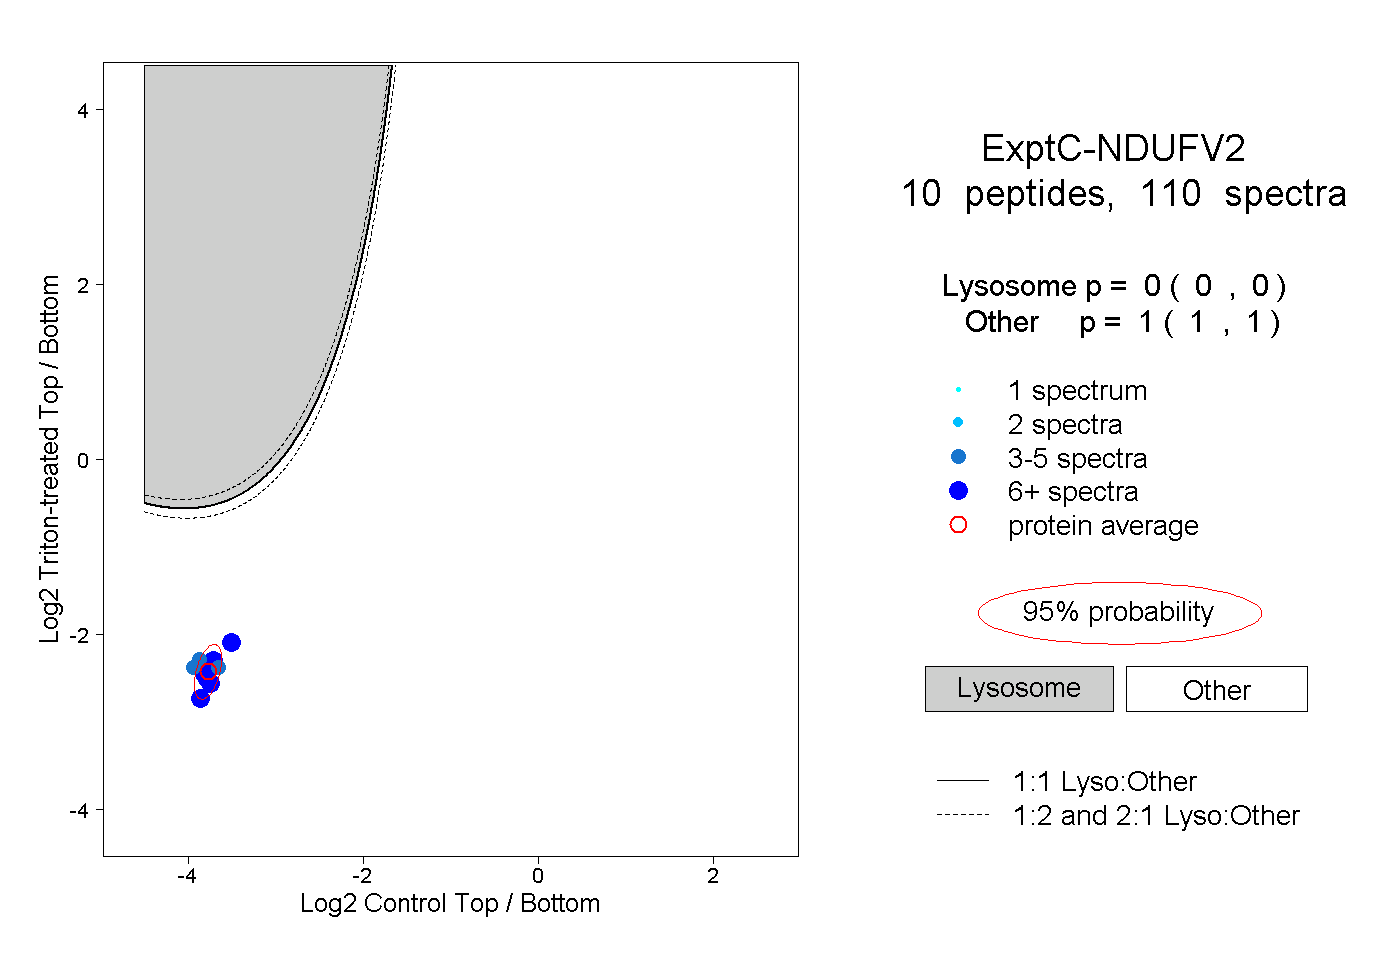 |
0.000 0.000 | 0.000 |
1.000 1.000 | 1.000 |
||||||||
| Plot | Lyso | Other | |||||||||||
| Expt D |
6 peptides |
18 spectra |
 |
0.000 0.000 | 0.292 |
1.000 0.705 | 1.000 |