 28
28peptides
spectra
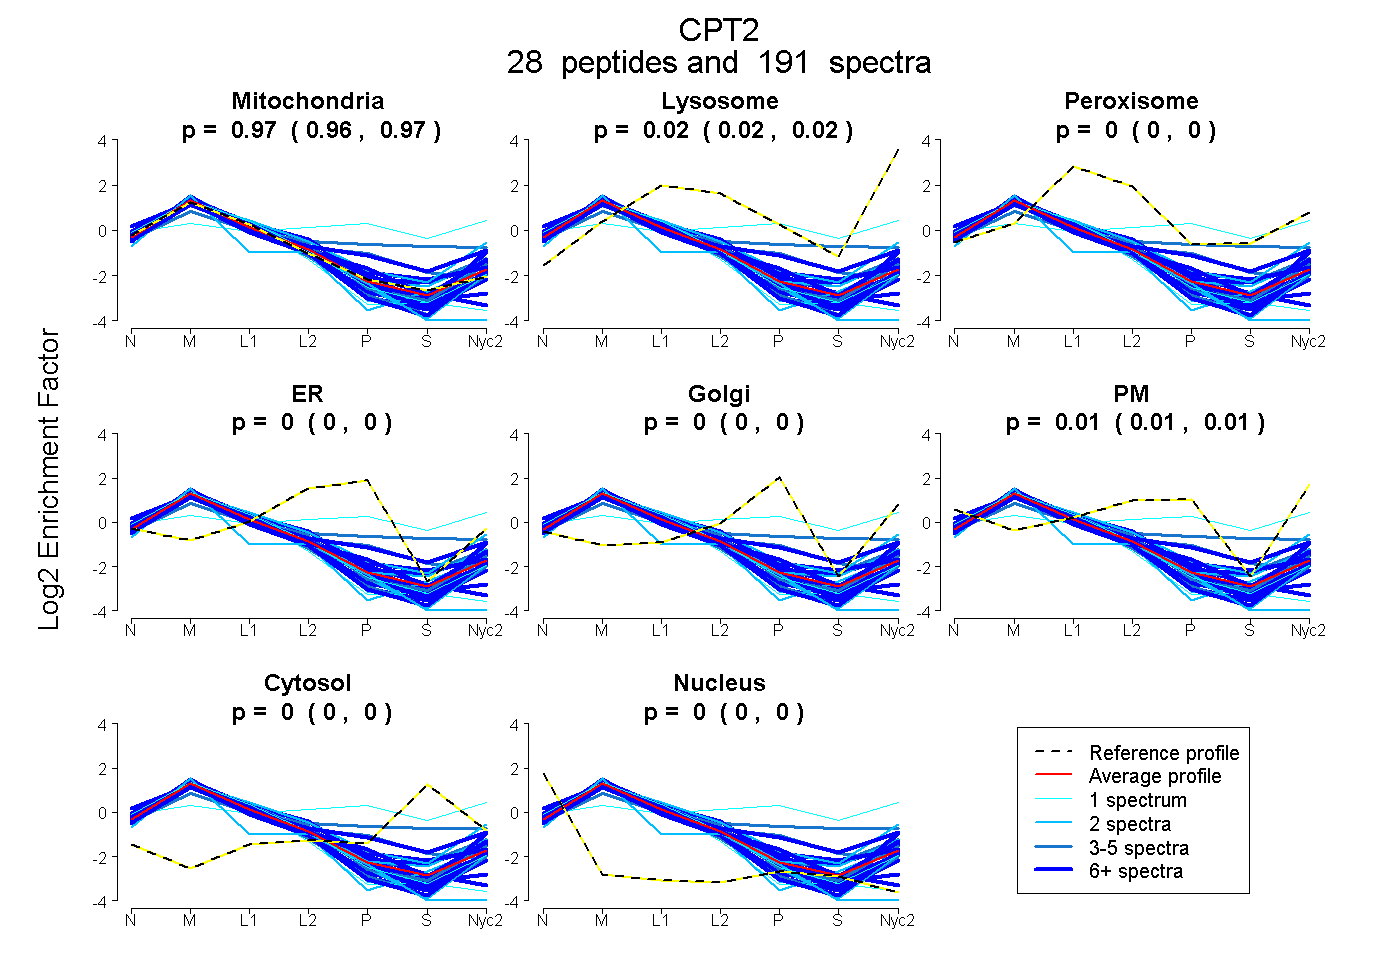
0.965 | 0.970
0.017 | 0.024
0.000 | 0.000
0.000 | 0.000
0.000 | 0.000
0.007 | 0.015
0.000 | 0.000
0.000 | 0.000
21peptides
spectra
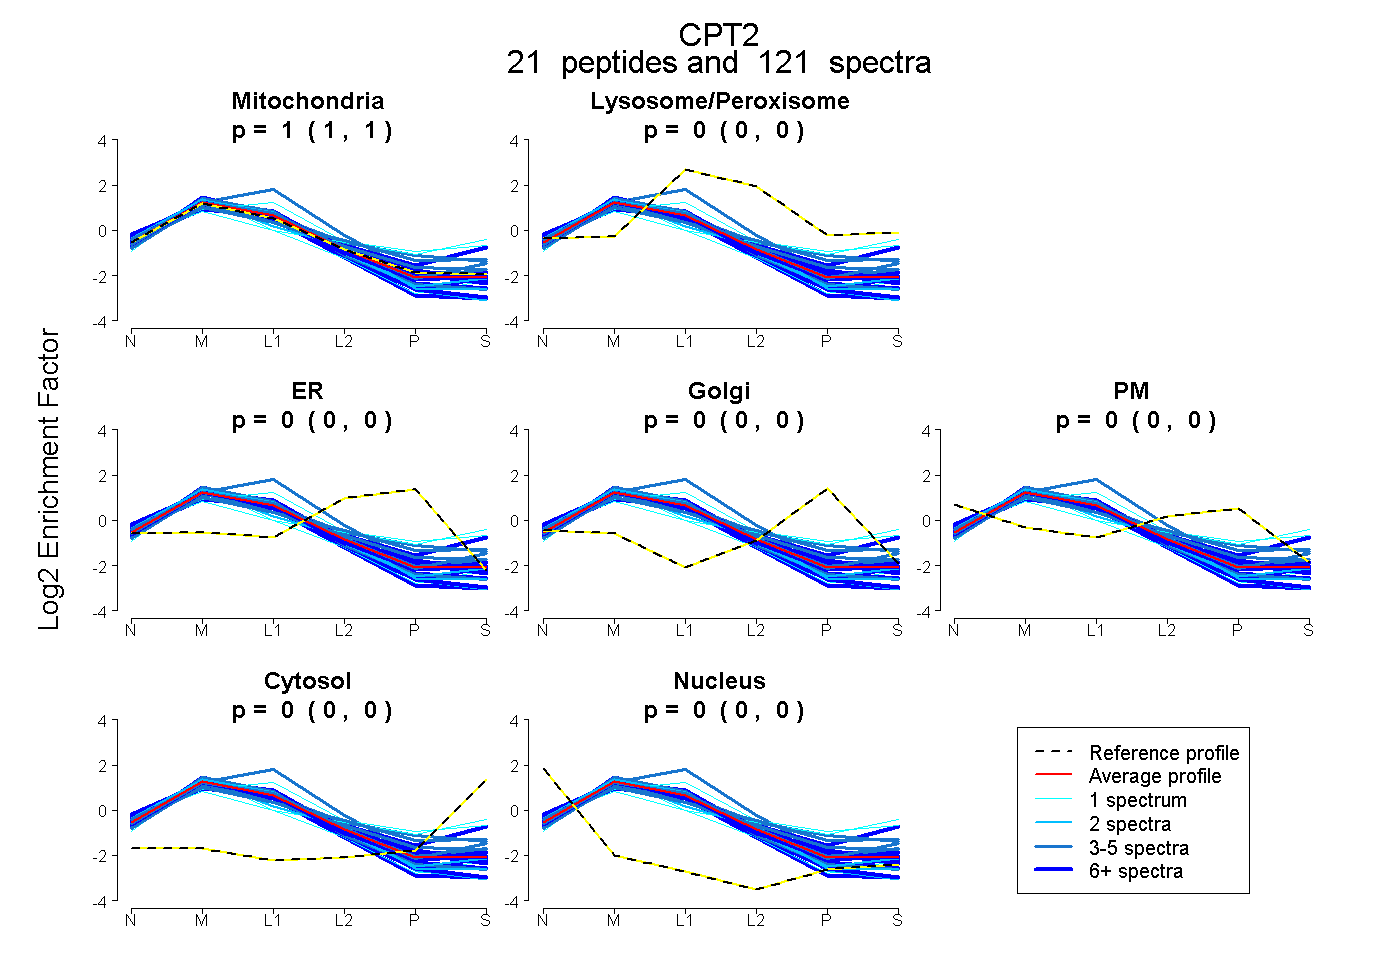
1.000 | 1.000
0.000 | 0.000
0.000 | 0.000
0.000 | 0.000
0.000 | 0.000
0.000 | 0.000
0.000 | 0.000
31peptides
spectra
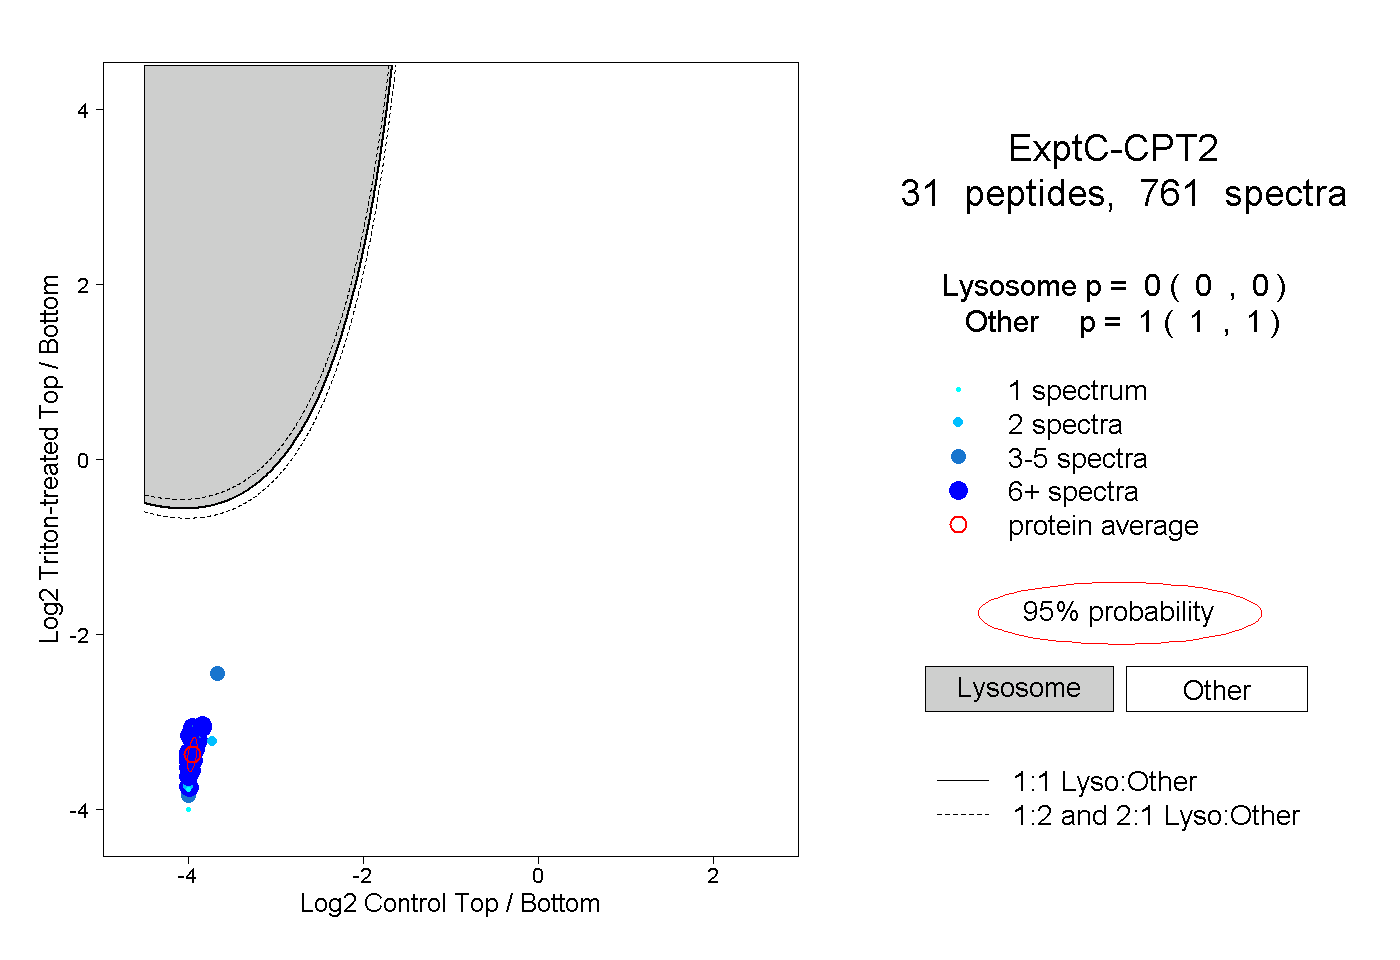
0.000 | 0.000
1.000 | 1.000
17peptides
spectra
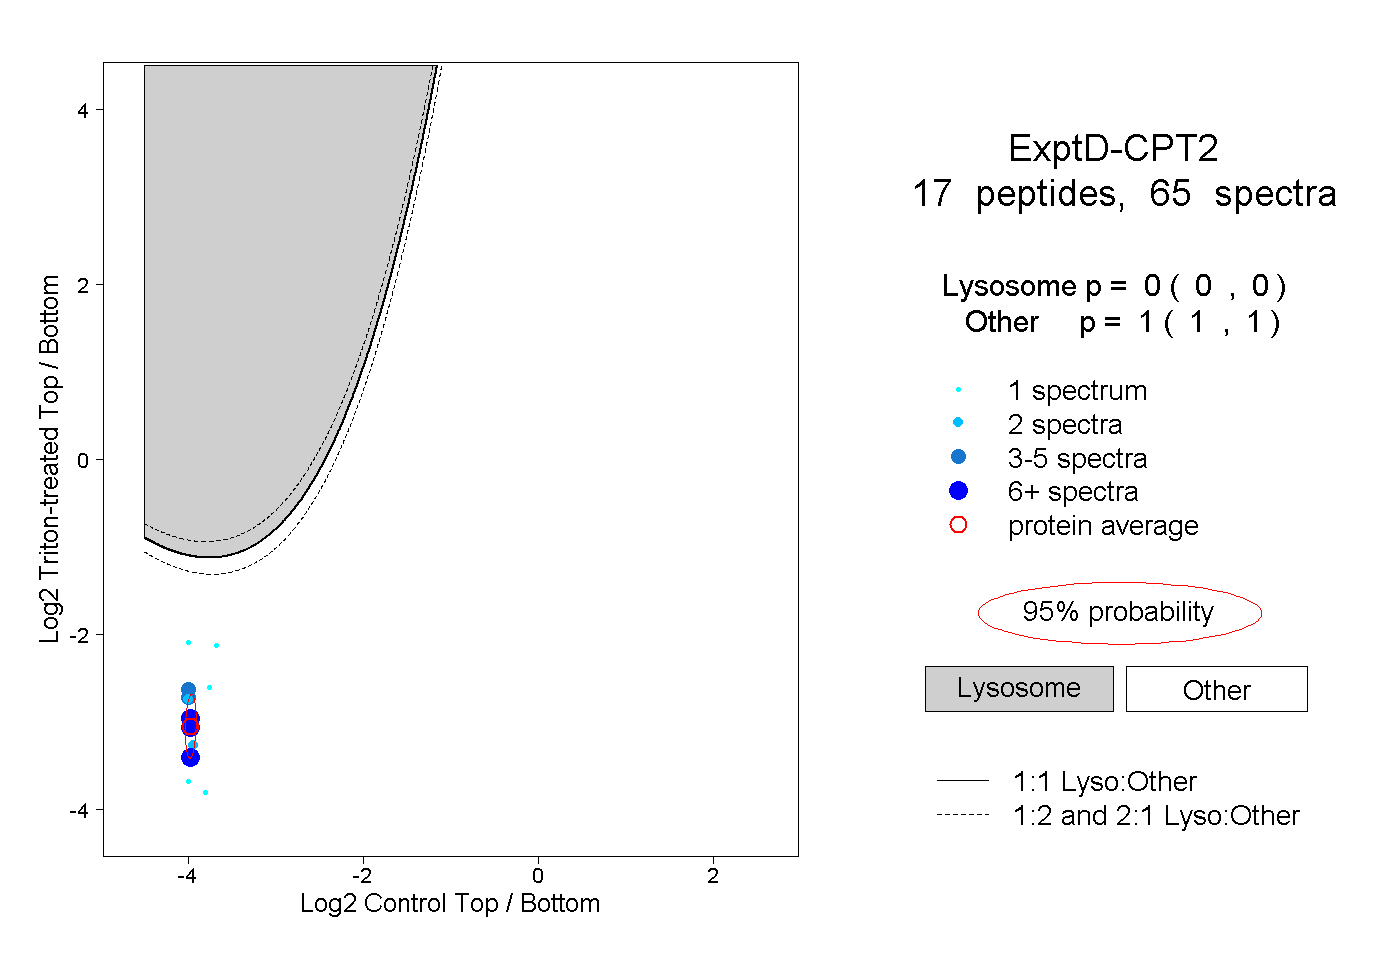
0.000 | 0.000
1.000 | 1.000