 10
10peptides
spectra
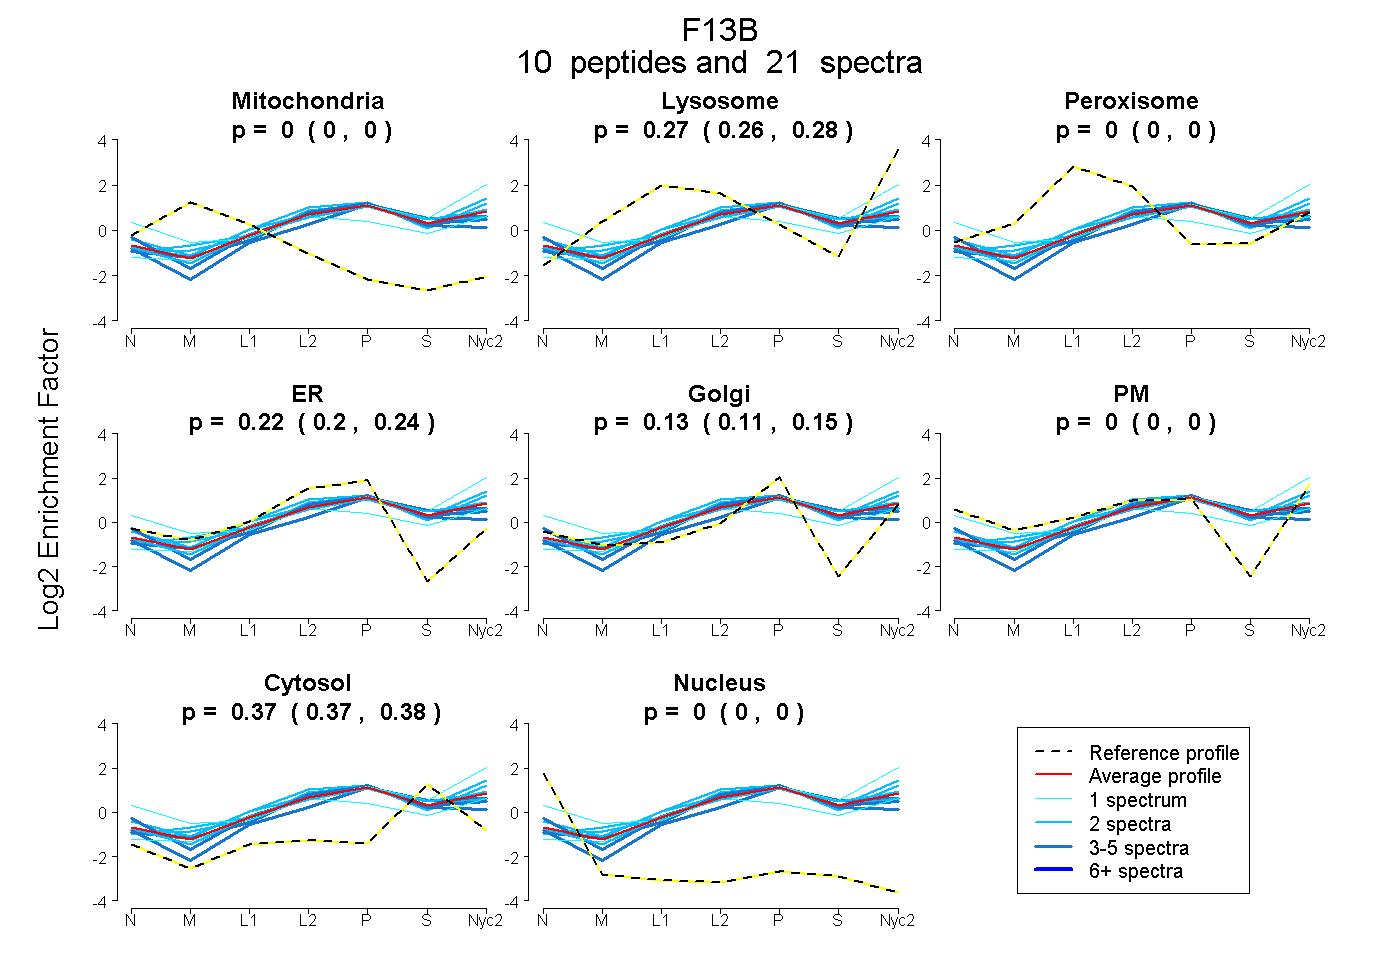
0.000 | 0.000
0.258 | 0.278
0.000 | 0.000
0.200 | 0.242
0.113 | 0.152
0.000 | 0.000
0.368 | 0.380
0.000 | 0.000
11peptides
spectra
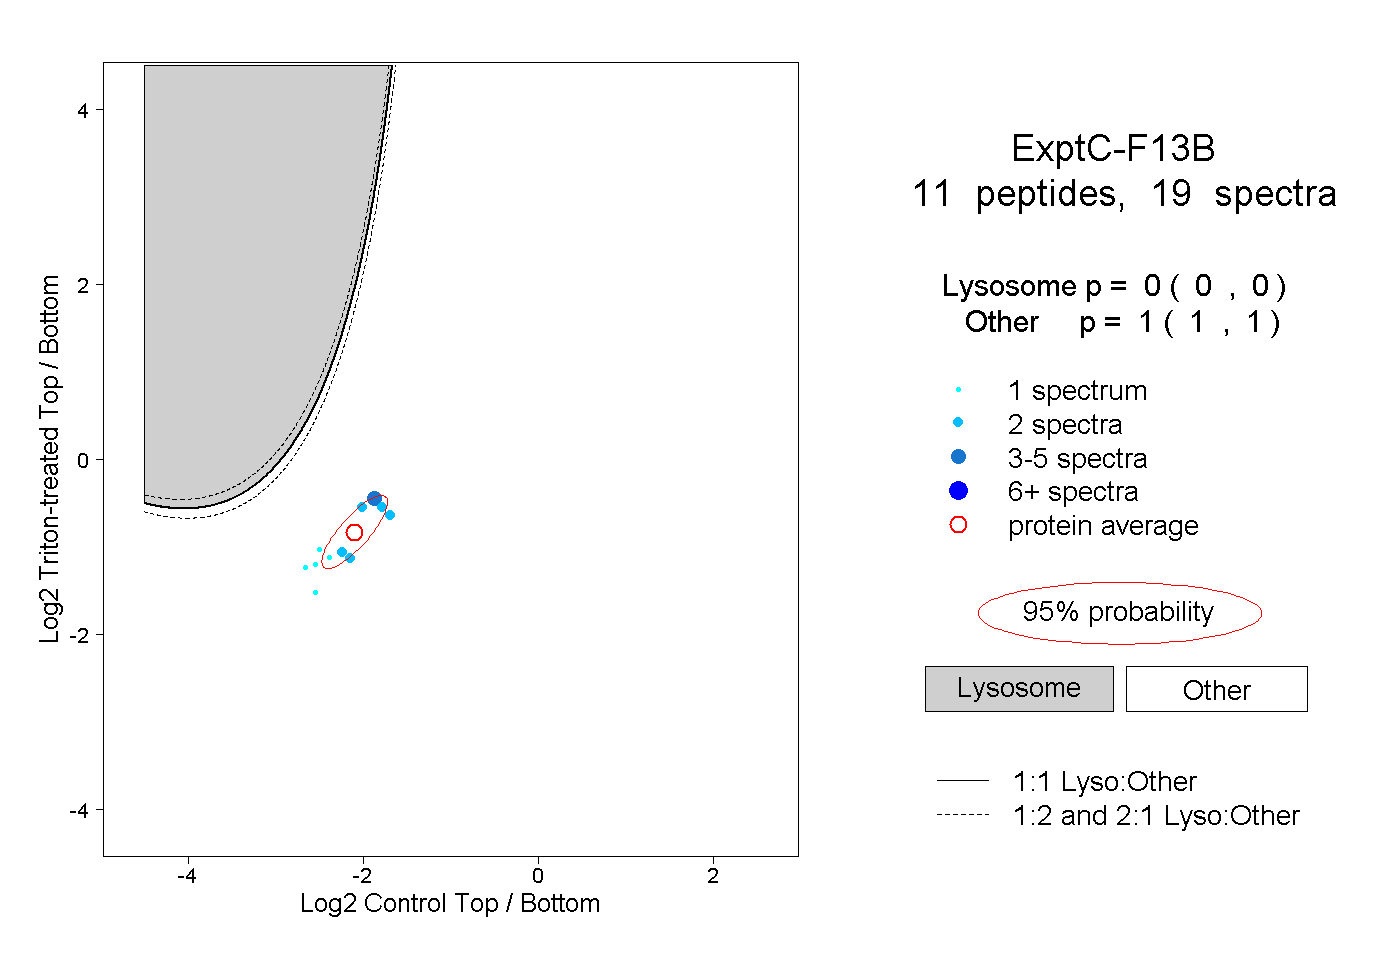
0.000 | 0.000
1.000 | 1.000
4peptides
spectra
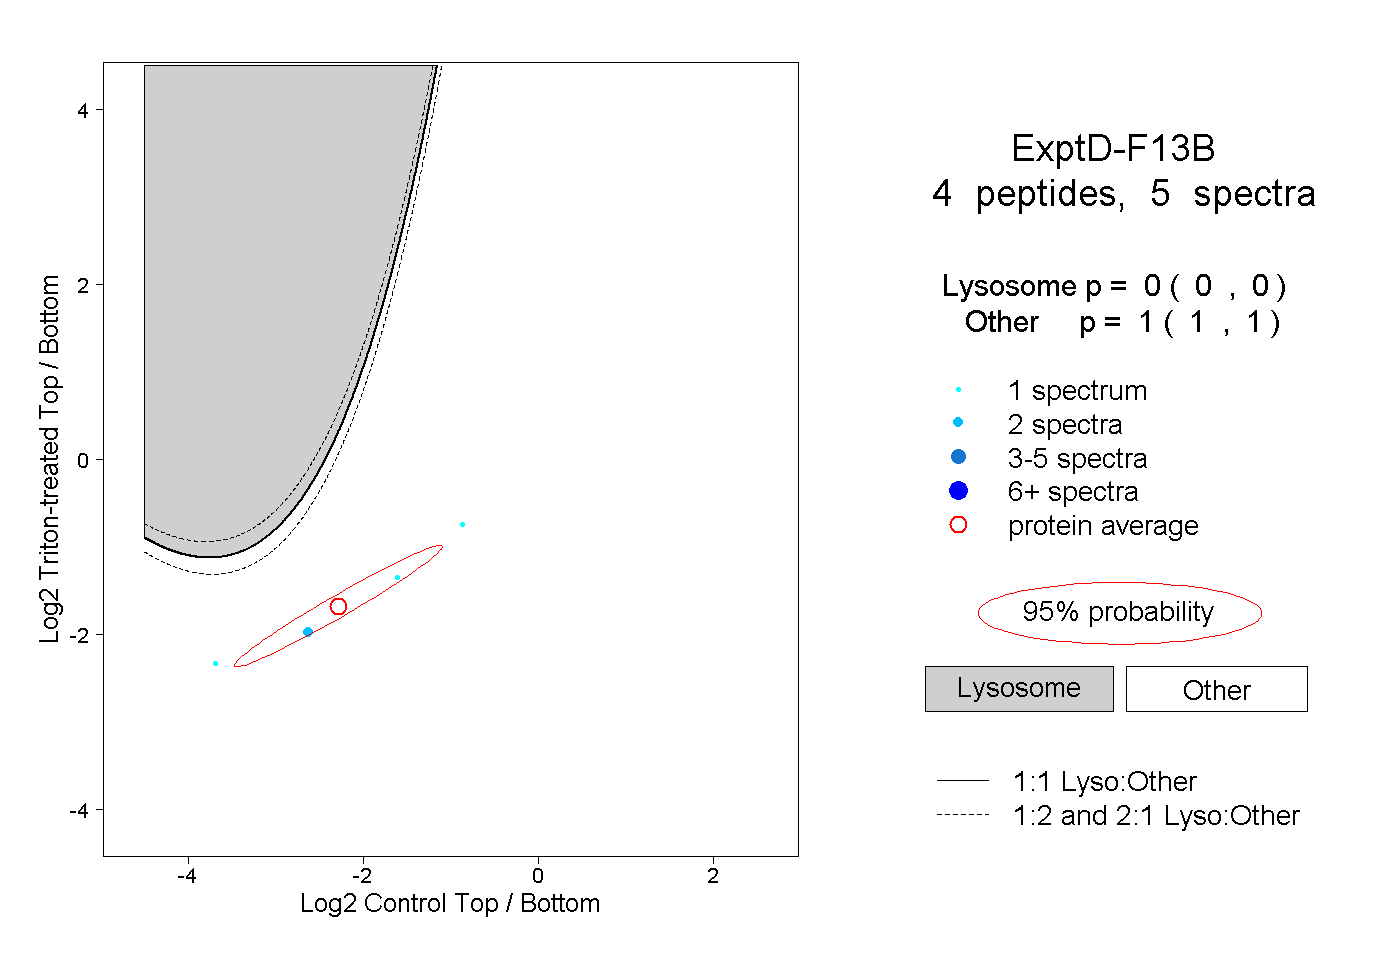
0.000 | 0.000
1.000 | 1.000