 10
10peptides
spectra
0.000 | 0.000
0.258 | 0.278
0.000 | 0.000
0.200 | 0.242
0.113 | 0.152
0.000 | 0.000
0.368 | 0.380
0.000 | 0.000
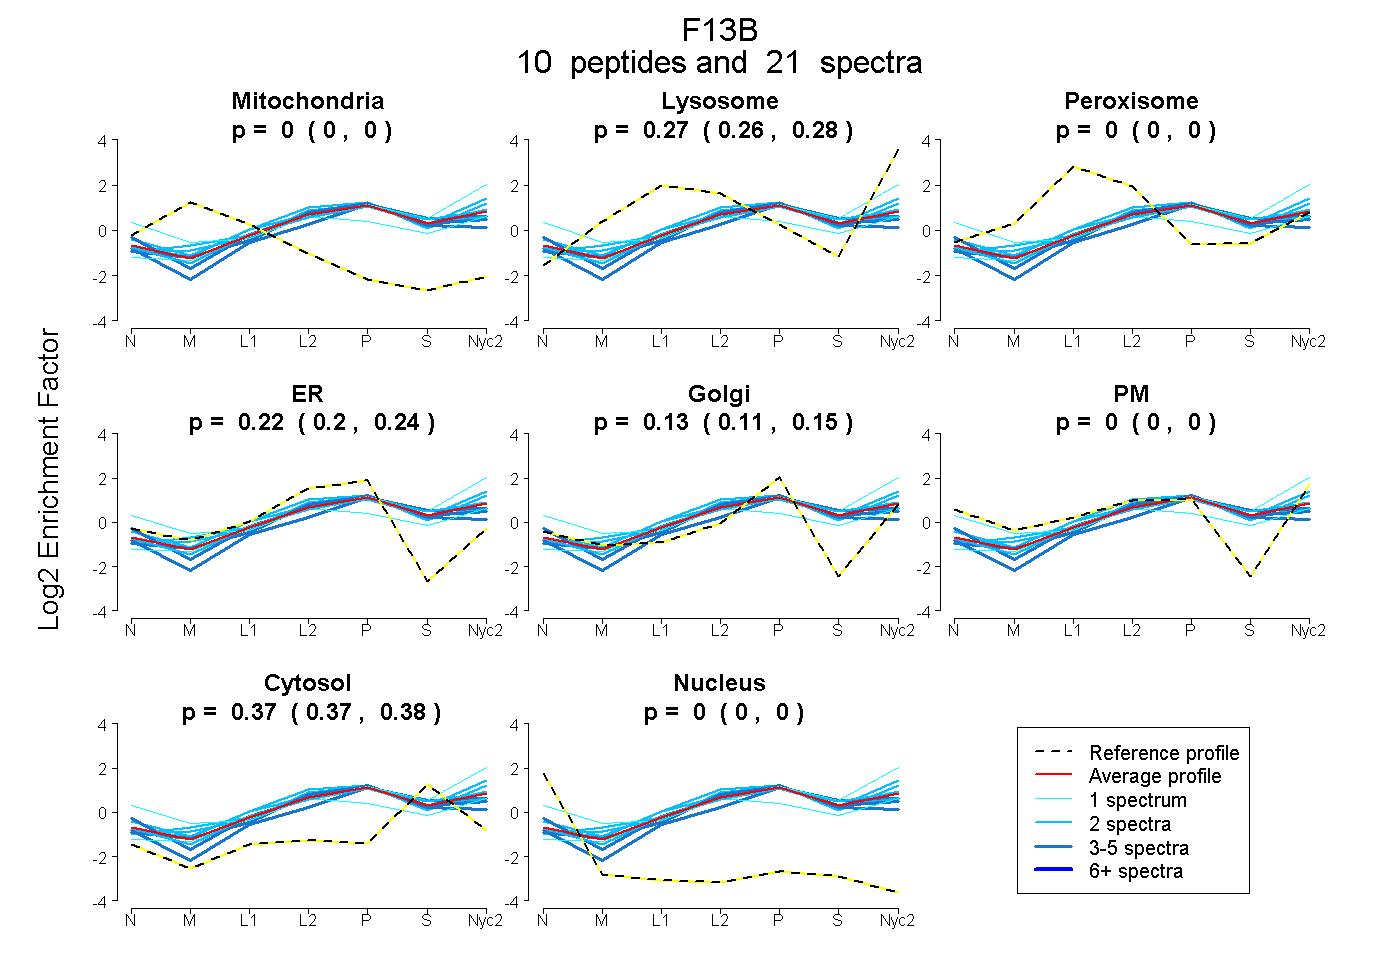
| Plot | Mito | Lyso | Perox | ER | Golgi | PM | Cytosol | Nucleus | |||||
| Expt A |
10 peptides |
21 spectra |
|
0.000 0.000 | 0.000 |
0.269 0.258 | 0.278 |
0.000 0.000 | 0.000 |
0.222 0.200 | 0.242 |
0.135 0.113 | 0.152 |
0.000 0.000 | 0.000 |
0.374 0.368 | 0.380 |
0.000 0.000 | 0.000 |
| 1 spectrum, YGCTSGYK | 0.000 | 0.437 | 0.000 | 0.000 | 0.227 | 0.000 | 0.337 | 0.000 | ||
| 3 spectra, GSSTITCNR | 0.000 | 0.059 | 0.088 | 0.363 | 0.094 | 0.006 | 0.390 | 0.000 | ||
| 2 spectra, CLKPVLR | 0.000 | 0.309 | 0.000 | 0.243 | 0.098 | 0.000 | 0.350 | 0.000 | ||
| 2 spectra, CTAEGWSPKPR | 0.000 | 0.307 | 0.000 | 0.242 | 0.057 | 0.096 | 0.298 | 0.000 | ||
| 3 spectra, GMCASPPVIR | 0.000 | 0.157 | 0.000 | 0.097 | 0.269 | 0.000 | 0.477 | 0.000 | ||
| 3 spectra, LMCSSLR | 0.000 | 0.212 | 0.000 | 0.337 | 0.051 | 0.000 | 0.400 | 0.000 | ||
| 2 spectra, YPVCVR | 0.000 | 0.275 | 0.000 | 0.172 | 0.145 | 0.000 | 0.408 | 0.000 | ||
| 2 spectra, GDAYMTETSIPESELR | 0.000 | 0.375 | 0.000 | 0.083 | 0.232 | 0.000 | 0.310 | 0.000 | ||
| 1 spectrum, VACEQPPSVENGVADPR | 0.000 | 0.000 | 0.132 | 0.000 | 0.000 | 0.527 | 0.341 | 0.000 | ||
| 2 spectra, ILHGDMIDFVCK | 0.000 | 0.286 | 0.000 | 0.306 | 0.030 | 0.000 | 0.378 | 0.000 |
| Plot | Lyso | Other | |||||||||||
| Expt C |
11 peptides |
19 spectra |
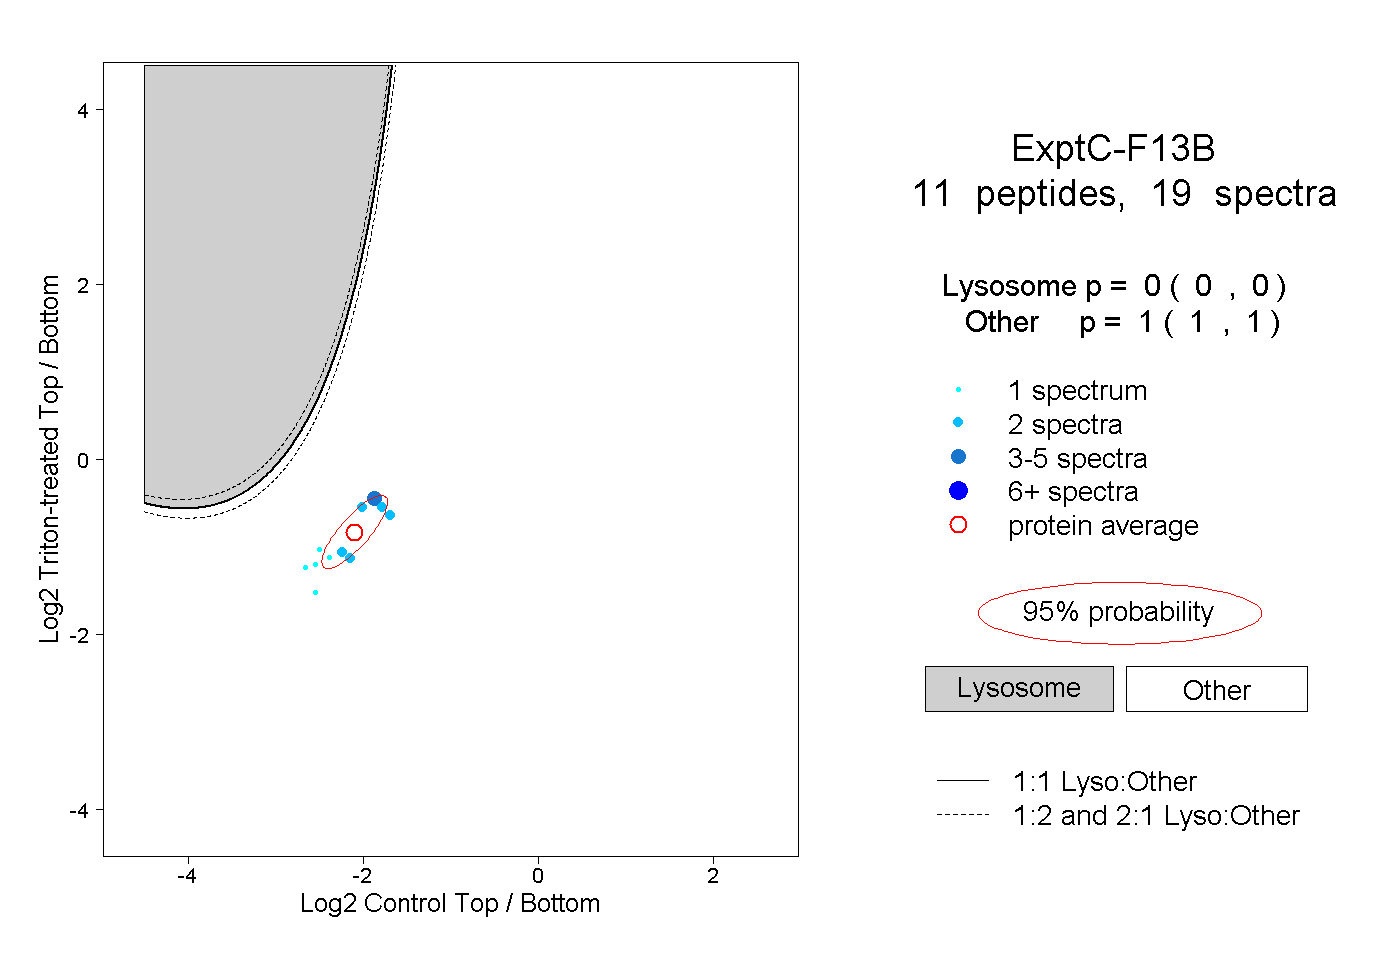 |
0.000 0.000 | 0.000 |
1.000 1.000 | 1.000 |
||||||||
| Plot | Lyso | Other | |||||||||||
| Expt D |
4 peptides |
5 spectra |
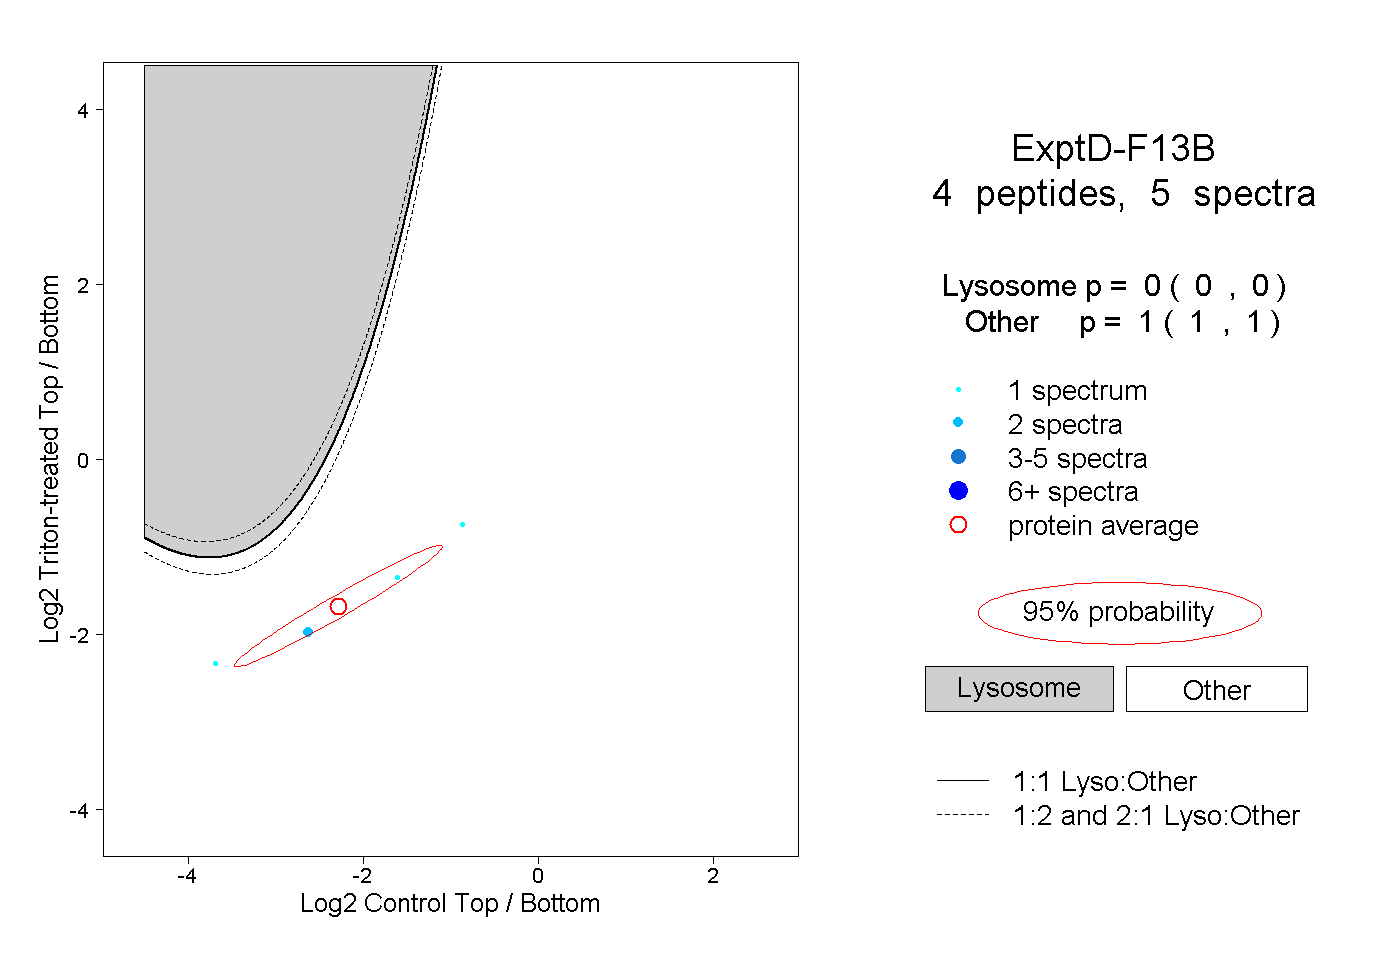 |
0.000 0.000 | 0.000 |
1.000 1.000 | 1.000 |